
Bitcoin Strengthens for Potential Breakouts
SOL, AVAX, and EOS Prices Show Promise, Primed for Upside Action if Bitcoin Surges Above $31,000
In June, nonfarm payrolls increased by 209,000, falling short of economists’ expectations of adding 240,000 jobs. This data indicates a slowdown in the labor market, but concerns remained as average hourly earnings growth remained steady at 0.4% compared to May and 4.4% compared to the previous year.
Despite the report, expectations of a 25 basis point interest rate hike in the next United States Federal Reserve meeting remained unchanged, according to the FedWatch Tool. This caused pressure on the U.S. equities markets, leading to a decline in all three major indices for the week. The S&P 500 dropped by 1.16%, and the Nasdaq decreased by 0.92%.
Another factor affecting the crypto markets negatively was a report by JPMorgan managing director Nikolaos Panigirtzoglou, suggesting that a spot Bitcoin exchange-traded fund (ETF) with a price of $30,124 may not have a significant impact on the crypto space. Panigirtzoglou pointed to the lackluster interest in spot Bitcoin ETFs in Canada and Europe as a possible reason for its limited influence, even in the United States.
Whether bullish investors can regroup and push Bitcoin above the resistance level remains. If they succeed, it could lead to an upward trend for select altcoins. Let’s examine the charts of the top cryptocurrencies displaying signs of upward movement.
Bitcoin
Bitcoin’s price has been trading within a range, trapped between the 20-day exponential moving average at $29,866 and the overhead resistance at $31,500. This indicates a sense of uncertainty among both bullish and bearish traders regarding the next significant move.
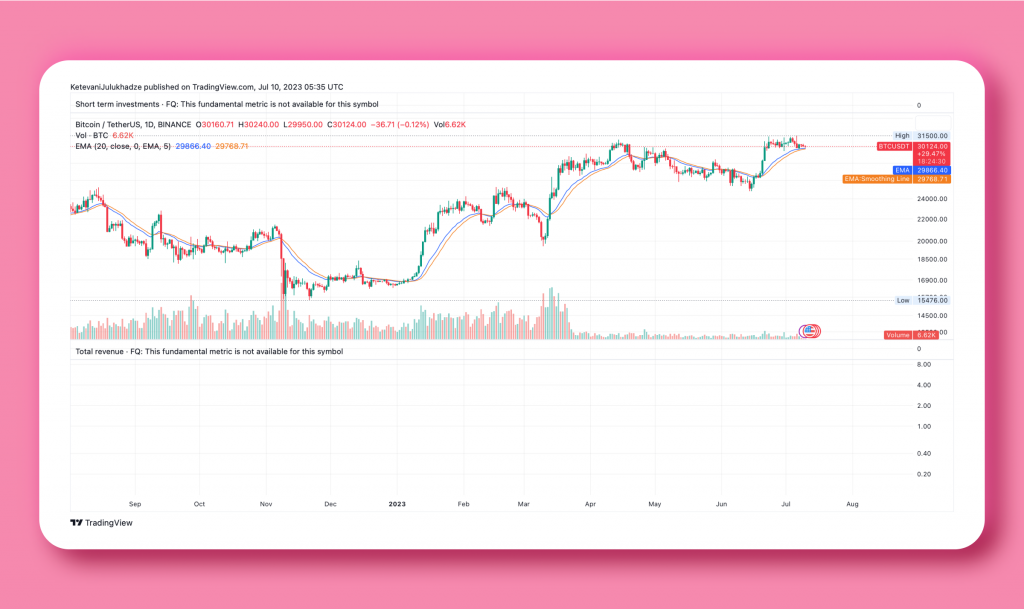
On the daily chart of the BTC/USDT pair, the recent bounce off the 20-day EMA on July 7 suggests strong defense by the bulls at that level. The buyers are expected to make another attempt to surpass the $31,500 resistance, potentially initiating the next phase of the uptrend. If successful, the pair could advance toward $32,400 and potentially aim for $40,000.
However, the bears have their agenda and will likely defend the overhead resistance. Their goal is to pull the price below the support level at $29,500, triggering stop losses of short-term bulls. Such a breakdown could lead to a decline toward the 50-day simple moving average, currently around $28,101.
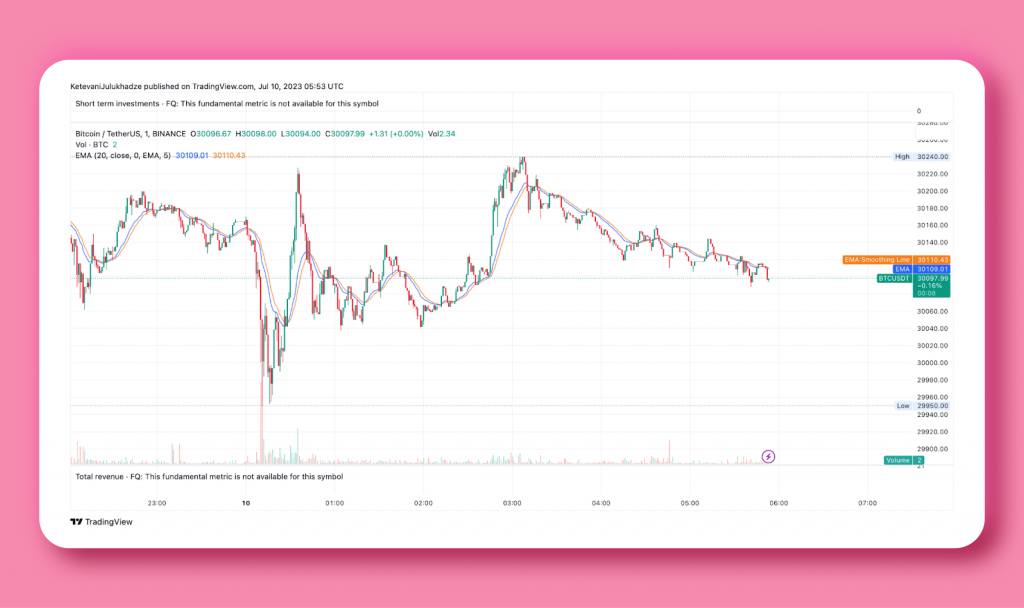
On the 4-hour chart, the BTC/USDT pair is confined within the range of $29,950 and $31,500. Typically, tight-range trading is followed by a breakout or range expansion, but predicting the direction of the breakout is challenging. Therefore, waiting for the price to break out of the range is advisable before considering significant trading positions.
Solana
Solana (SOL) has been trading within a wide range of $14.29 to $27.12 for several months. However, a recent failure to sustain prices below the lower boundary sparked an upward movement, breaking above the downtrend line and indicating a potential comeback by the bulls.
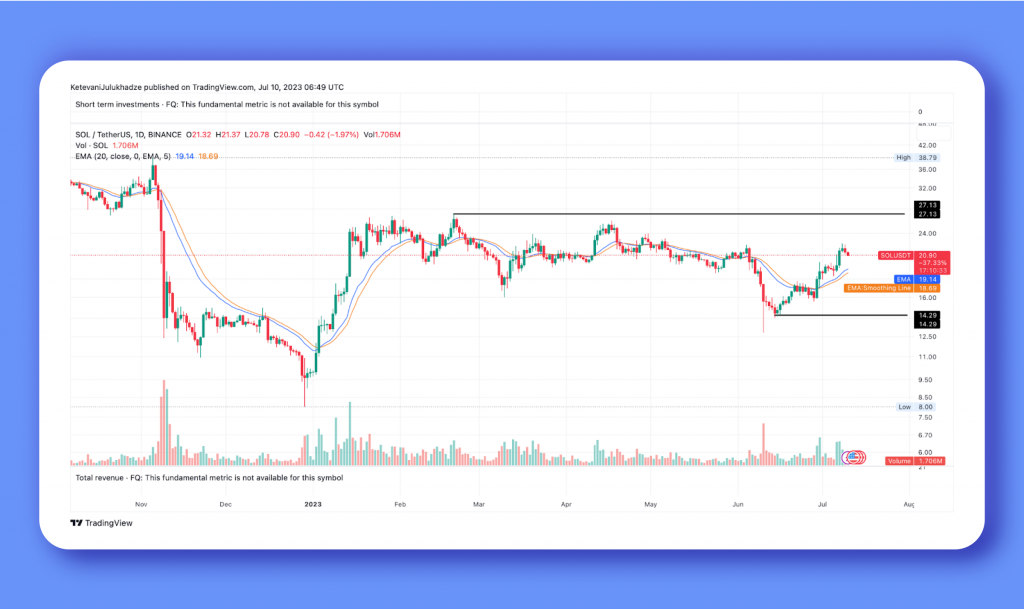
The moving averages have formed a bullish crossover, and the Relative Strength Index (RSI) is nearing the overbought territory, suggesting that the path of least resistance is upwards. While a minor resistance lies at $22, a successful breach of this level could pave the way for a rally towards $24 and, ultimately, the significant overhead resistance at $27.12.
Should the price exhibit a strong rebound from the 20-day exponential moving average (EMA) at around $20.90, the bulls will likely make another attempt to surpass the obstacle at $21. The SOL/USDT pair could experience a notable surge toward $24 if successful.
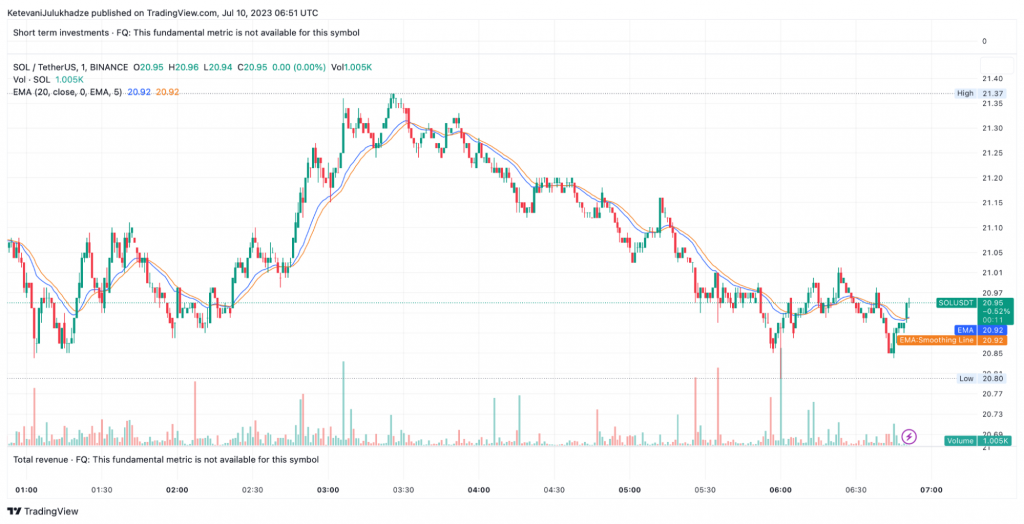
However, a drop below the 20-day EMA would signal profit-taking by short-term bulls, indicating potential weakness. In such a scenario, the pair may slide toward the 50-day simple moving average (SMA) for further support.
Avalanche
After facing resistance near the 50-day simple moving average (SMA) at $13.21 for several days, Avalanche (AVAX) successfully breached the level on July 10.
The moving averages are on the verge of completing a bullish crossover, and the Relative Strength Index (RSI) has entered positive territory, indicating an advantage for the bulls. The AVAX/USDT pair has the potential to rise toward $16, where strong resistance from bears may be encountered.
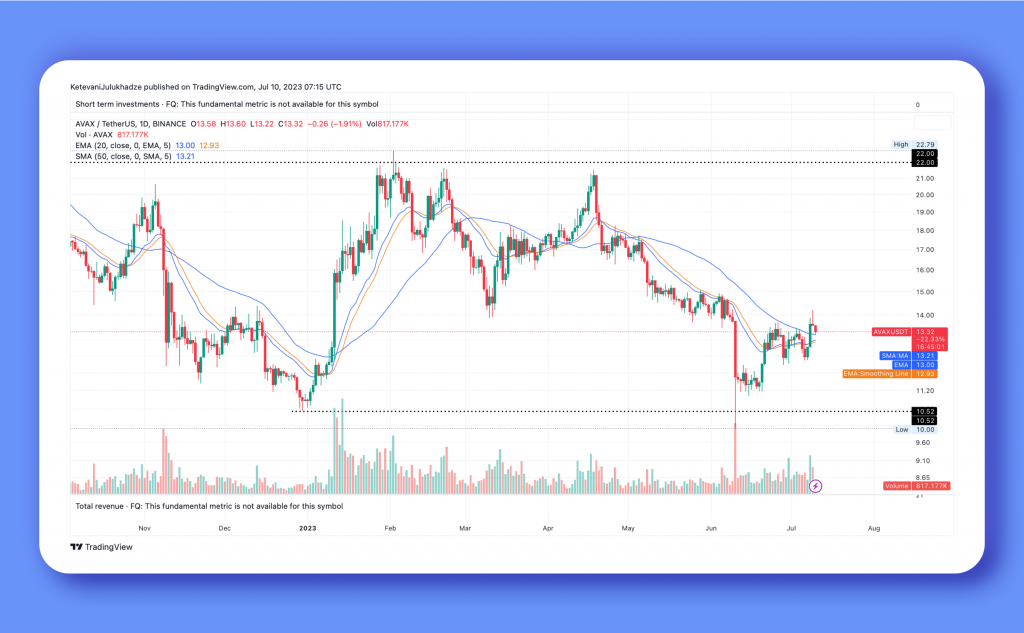
In case of subsequent corrections, finding support at the 20-day exponential moving average (EMA) at $13 would signal the beginning of an upward movement toward $18. On the downside, a critical support level to monitor is $12, and a break below this level could lead to a decline toward the important support at $10.52.
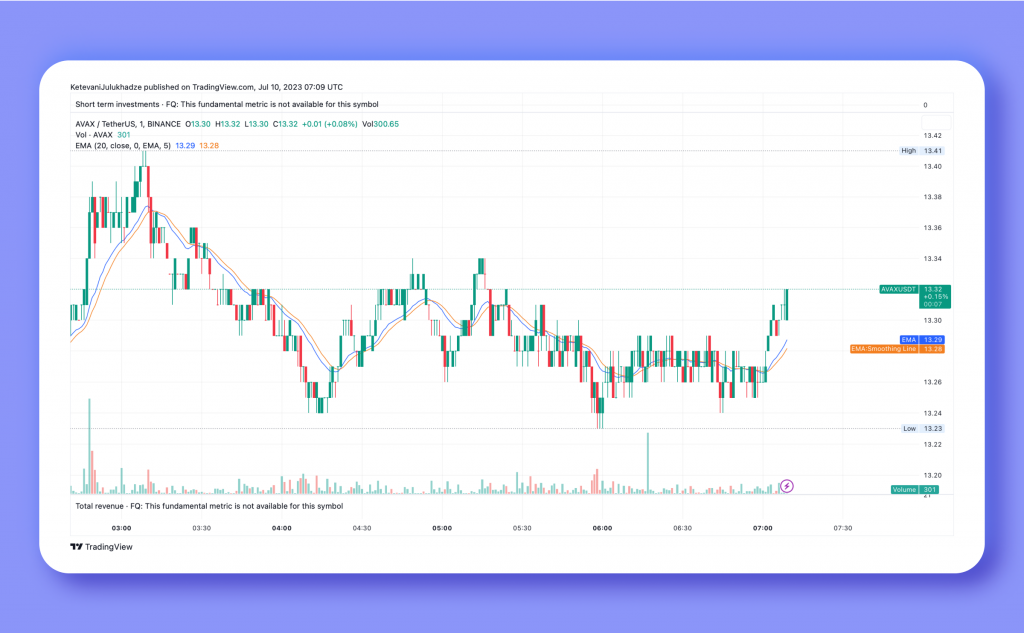
On the 4-hour chart, the price of AVAX has surpassed the symmetrical triangle pattern, suggesting that the bulls are attempting to take control. Although selling pressure may emerge near the significant overhead resistance at $13.41, bulls are expected to buy the dips toward the 20-EMA. Maintaining support at this level increases the likelihood of a rally above $15.
If the bears aim to impede the upside momentum, they must swiftly push the price below the moving averages. Such a move could trap aggressive bulls and result in long liquidation, potentially causing the pair to slide toward the triangle’s support line.
EOS
EOS, currently priced at $0.71, has been displaying a pattern of higher highs and higher lows, indicating a potential trend change shortly.
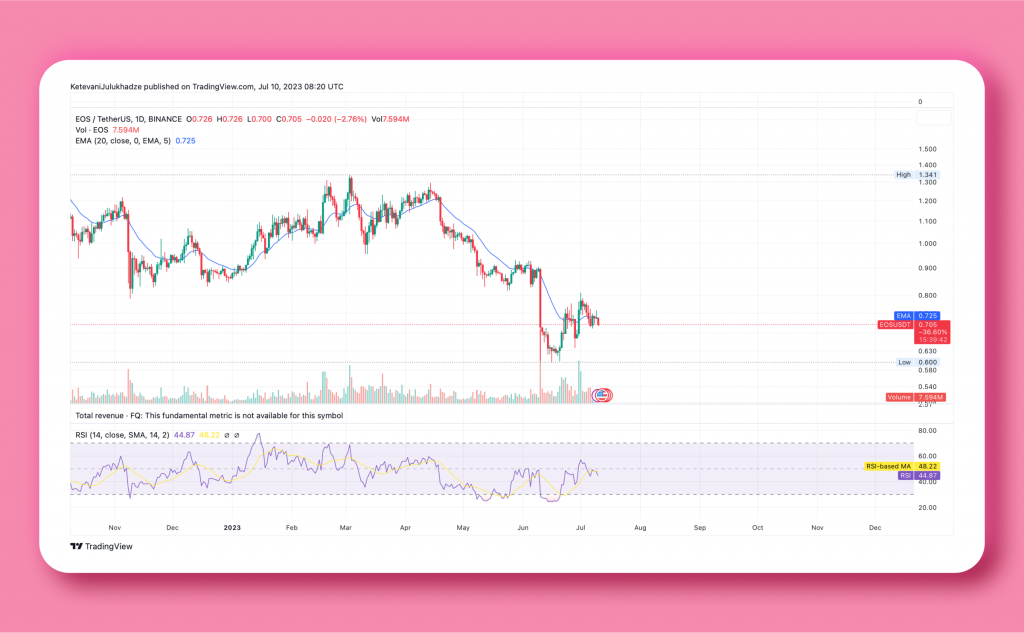
The 20-day exponential moving average (EMA) at $0.72 has flattened out, and the Relative Strength Index (RSI) is close to the midpoint, suggesting a reduction in selling pressure. For confirmation of a possible end to the downtrend, buyers would need to push the price above the overhead resistance at $0.74. If this level is breached, the EOS/USDT pair could experience a surge towards $0.93.
On the other hand, if the price reverses from the overhead resistance, it would suggest continued bearish activity at higher levels. This could result in the pair remaining range-bound between $0.60 and $1.34 for an extended period.
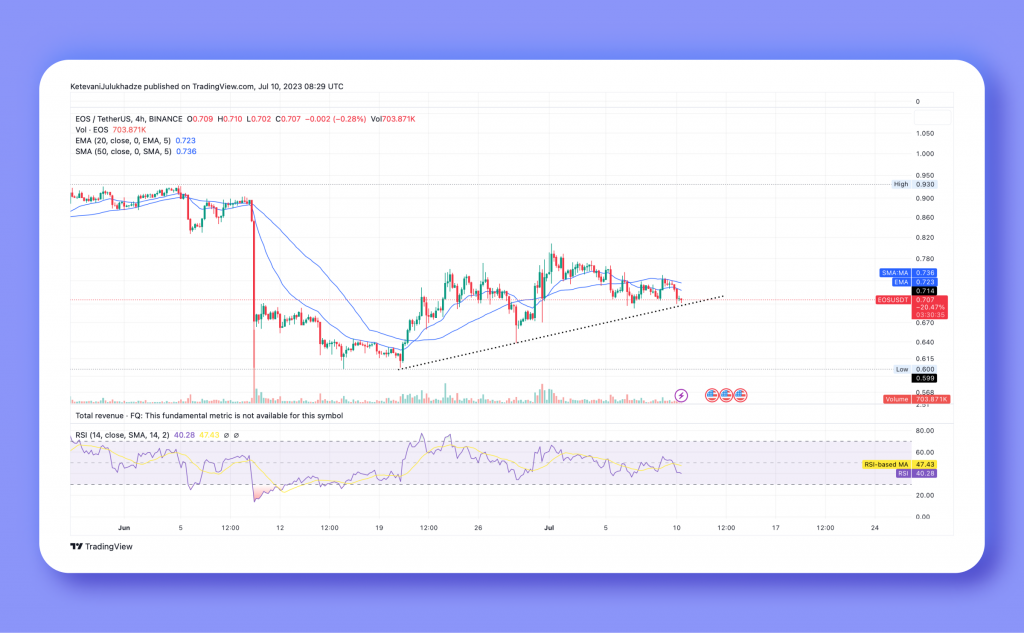
Based on the 4-hour chart analysis, a gradual upward movement is observed in the pair. If buyers cInan push the price above the 50-SMA (Simple Moving Average), it could lead to a retest of the resistance level at $0.79. A successful breakthrough of this resistance may further propel the pair’s value to $0.83 and potentially even reach $0.93.
However, if the price reverses its direction and breaks below the upward trend line, it indicates a shift in control to the bears. In such a scenario, the pair is likely to experience a decline towards $0.67 initially, and possibly further down to $0.60.
In Conclusion
Bitcoin’s recent strength and potential breakouts have created opportunities for select altcoins such as Solana (SOL), Avalanche (AVAX), and EOS. These cryptocurrencies have shown promising signs of upward movement, with key levels and indicators supporting bullish scenarios. However, it’s important for traders to exercise caution and wait for clear breakout signals before taking significant positions.


