
Spotting a Promising Buy the Dip Chance in Ethereum’s Price Charts
Over the course of the last nine months, Ethereum’s price has shown a consistent upward trend characterised by ascending channel patterns. Throughout this pattern development, the coin’s price has been oscillating between two parallel trendlines, serving as dynamic support and resistance levels for traders in the market.
The ETH price is nearing the lower trendline, indicating a potential opportunity for investors to capitalise on the upcoming recovery cycle.
Discussing The Daily Chart Of Ethereum
On the daily chart, Ethereum’s price continues to display a bullish outlook as long as the channel pattern remains intact. There is a possibility of a 5% drop, which could present an opportunity for investors to accumulate this altcoin for long-term buying.
The intraday trading volume for Ether is currently at $4.3 billion, suggesting a potential 10% loss in value.
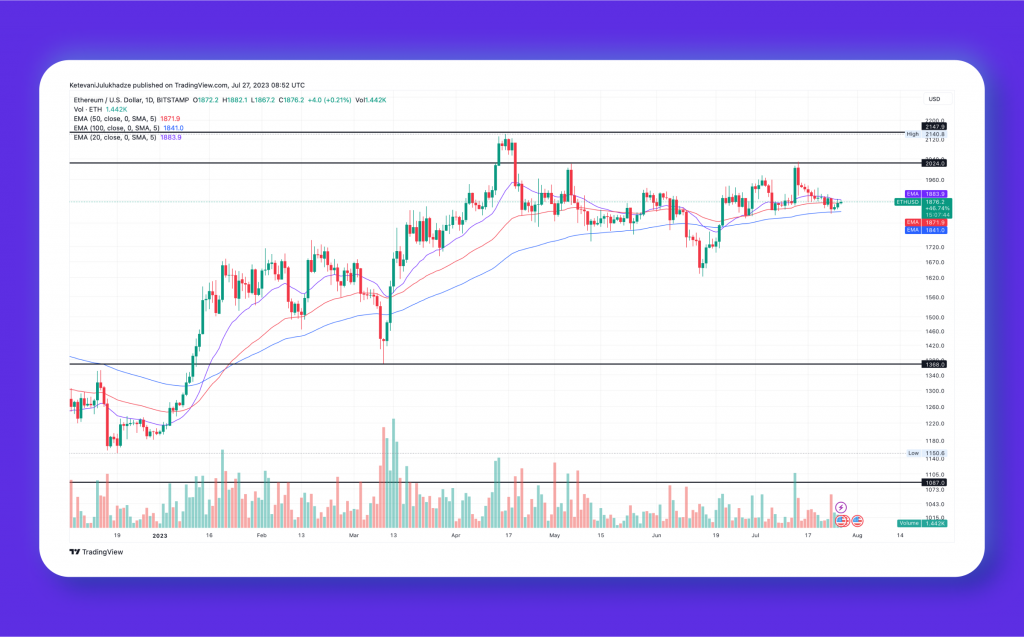
In the midst of ongoing market uncertainty, Ethereum’s price has witnessed a sharp reversal from the key psychological resistance level of $2000. Over the past two weeks, the coin’s value experienced an 8.5% decline, reaching its current trading price of $1876.
As the bearish sentiment persists, there is a possibility that coin sellers might prolong the correction by an additional 4-5%, potentially leading the price to revisit the well-established support trendline at $1800. However, it’s worth noting that during previous instances, the ETH price has shown resilience, rebounding multiple times from the dynamic support, offering a promising platform for investors to consider accumulating the second-largest cryptocurrency.
Should the altcoin’s price manage to sustain itself above the mentioned trendline, there is potential for buyers to initiate a new recovery cycle. In this scenario, a bullish reversal within the channel pattern could drive an upswing towards the overhead trendline, indicating the possibility of Ethereum surpassing its previous swing high of $2138 and potentially aiming for the $2400 mark.
As the crypto market continues to evolve, these trends provide valuable insights for investors seeking strategic opportunities within the Ethereum market.
ETH Price Amidst Correction: Prospects for Revisiting $1600 Explored
Amid the current market correction, there are concerns about whether Ethereum’s price could revisit $1600. Let’s explore the key indicators to gain insights into potential price movements.
Bearish Scenario and Price Targets
In a pessimistic situation, a breakdown below the bottom support trendline with a daily candle closing below it would invalidate the bullish thesis. Such a breach of the dynamic support level might hint at a major correction, potentially driving the coin’s market value to $1628, followed by $1368.
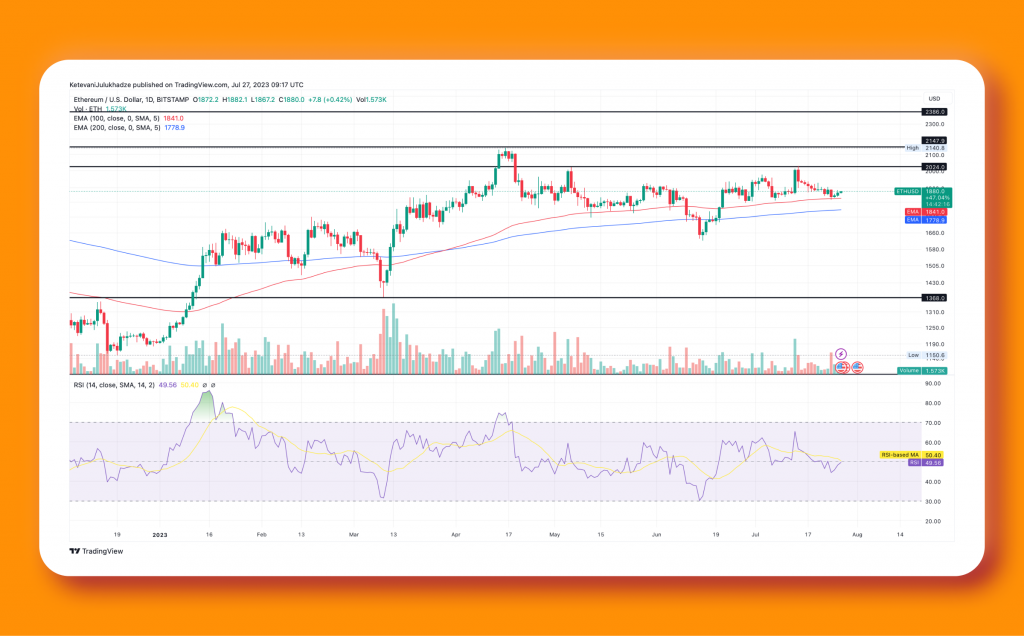
- Relative Strength Index (RSI): A daily RSI slope falling below the midline (50%) indicates sellers are gradually gaining control over Ethereum’s price movement. This bearish signal suggests caution for investors and traders alike.
- Exponential Moving Average (EMA): Currently, the coin price is trading above the 100-200 EMA, accentuating an overall bullish market sentiment. However, monitoring how these moving averages respond to price fluctuations is essential, as they can influence future market trends.
In conclusion, while the market correction raises concerns about a potential dip towards $1600, it is crucial to closely observe the key indicators like the RSI and EMA for further insights. A daily candle closing below the bottom support trendline could lead to a more significant correction, with potential price targets at $1628 and $1368. Investors should remain vigilant during this period of uncertainty and monitor these indicators to make informed decisions.


