
Understanding Candlestick Patterns In The Bullish Market.
Successful and profitable trading in any market is based on market analysis, for which traders use many different methods and tools. One such tool is a technical analysis using candlestick patterns. In this article, we will find out what a candlestick pattern is and discuss the most popular patterns used for the bullish market.
Key Takeaways
- The sellers in the market are called “bears”, while the buyers are called “bulls”.
- A sustained increase in prices characterizes a bull market.
- Candlestick patterns are used to predict the future direction of price changes.
- Traders use more than 60 candlestick patterns for market analysis.
Bull Market vs Bear Market
Any market consists of buyers and sellers. In the market, it is customary that sellers are called “bears” and buyers — “bulls”. They are responsible for creating a bear or bull trend in the market, depending on whether bulls or bears dominate.
A bearish trend (or bear market) is formed when the sellers prevail. Their strategy is to sell their assets before they fall in price. A market is usually considered an actual “bear” market if it has fallen 20% or more from recent highs.
A bearish market leads to economic pessimism and reduced consumption, which can further amplify the negative effect of a bear market.
There are various reasons for the emergence of a bear market, for example, a general economic slowdown, a pandemic, or war. Moreover, as a rule, the bear market does not stop at a 20% drop, and the meltdown can be more serious. For example, during the global financial crisis 2008, the S&P500 sank 52%.
A bullish trend (or bull market) is formed when buyers dominate the market. They predict the increase in asset prices and thus benefit from this growth.
A sustained increase in prices characterizes a bull market. The US Securities and Exchange Commission defines a bull market as a time when prices are rising and market sentiment is optimistic. Typically, a bull market occurs when the broad market index increases by 20% or more for at least two months.
The beginning of a bull market often serves as a key indicator of economic growth. As investors’ expectations of future economic conditions push stocks higher, the market rises before the economic system even shows signs of strengthening.
The bull market and the bear market are changing each other, which means that the prices change direction: after the growth, they fall, and vice versa.
Historically, bull markets prevailed against bear markets. Thus, since 1928, there have been 26 bear and 27 bull markets in the US S & P 500 index.
The bull market usually lasts longer than the bear market, and its profits significantly exceed the losses incurred by the bear market. The bull market lasts about three years on average, while the average duration of a bear market is only ten months.
What is a Candlestick Pattern
Candlestick patterns are used to predict the future direction of price movement.
A candlestick is a means of displaying information about the price movement of an asset. Candlestick charts are one of the most popular technical analysis components, allowing traders to render price information by just a few price bars quickly.
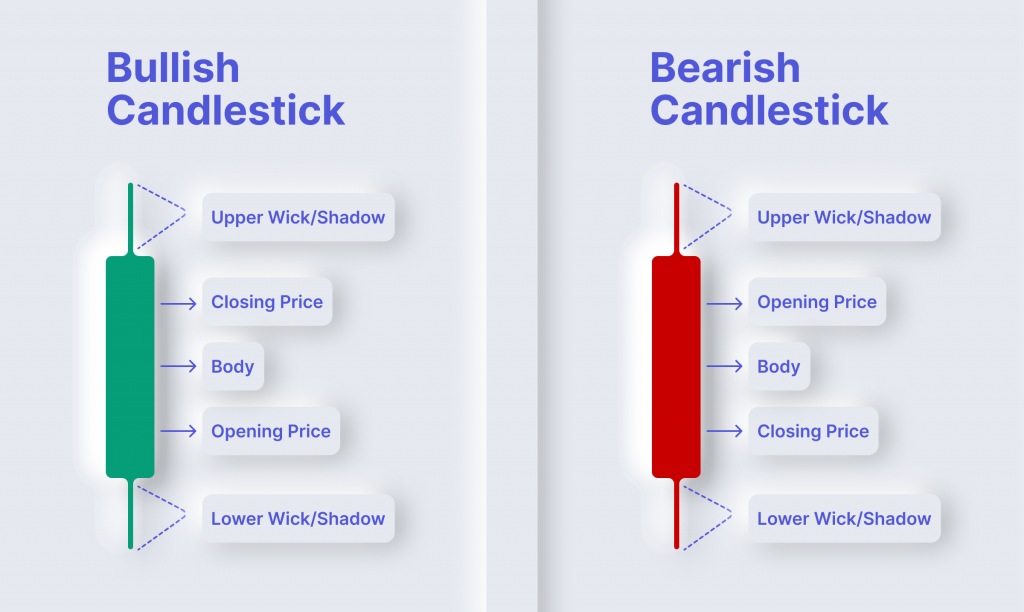
Three main elements of a candlestick help investors read the candlestick and analyze the market:
- The body is the area between the open and the close;
- Shadow (sometimes referred to as wick) displays the highest and lowest traded prices of an asset during the time interval represented;
- The color of the body represents the direction of market movement: the green (or white) body indicates that the prices increase — the bull trend — and the red (or black) body shows the prices fall — the bear trend. Though green and red are the most common colors for the candlesticks, some platforms (for example, TradingView) allow you to customize the chart by coloring candles in any color.
The length of the candlestick depends on how dynamically the price moves. The greater the spread between prices, the longer the element is.
Over time, individual candles form patterns traders can use to recognize significant market shifts and conduct technical analysis.
Candlestick patterns are a financial technical analysis tool that graphically depicts daily price movement information on a candlestick chart.
Candlesticks are created by up and down movements in the price, which often form patterns traders use for analysis or trading purposes.
Patterns are used in trading cryptocurrencies, stocks, futures and other exchange assets as part of technical analysis. They are widely used in day trading, swing trading and mid-term trading.
Patterns can be grouped into two categories: bullish and bearish.
Bullish patterns indicate that the price is likely to rise, that is, these are the patterns where the closing price for the period of an asset was higher than the opening price. This creates buying pressure for the investor due to potential continued price appreciation.
Bearish patterns indicate that the price is likely to fall. These patterns indicate where the closing price for the period of stock was lower than the opening price. This creates immediate selling pressure for the investor due to a price decline assumption.
Before you start trading, it is essential to learn the basics of candlestick patterns and how they influence your trading decisions. It is crucial to remember that candlestick patterns represent tendencies in price movement, not guarantees.
Candlestick patterns serve as an additional aid in the analysis. Their readings should be compared with the assessment of volumes, indicators, order books, and other analytical methods.
Brief Overview of the Most Popular Bullish Patterns
In a bull market, investors benefit from rising prices by buying stocks early in the trend and selling them when they have reached their peak.
During the bullish market, any losses are minor and temporary, and investors can invest in more equity with a higher probability of making a profit.
Investors rely on thorough technical analysis and bull candle patterns to profit from the bull market. There are more than 60 candlestick patterns; let’s look at some of the most popular ones used in the bullish market.
Hammer
This bullish candle pattern is characterized by a small candle body, no upper shadow and a long lower shadow that is longer in height than the candle’s body. The color of the body of a hammer candlestick can be either green or red. The green hammer is considered to be more bullish than the red hammer because it suggests that buyers have undertaken the market. However, regardless of the color, the hammer pattern indicates a bearish trend reversal, meaning there may be a potential uptrend in the market.
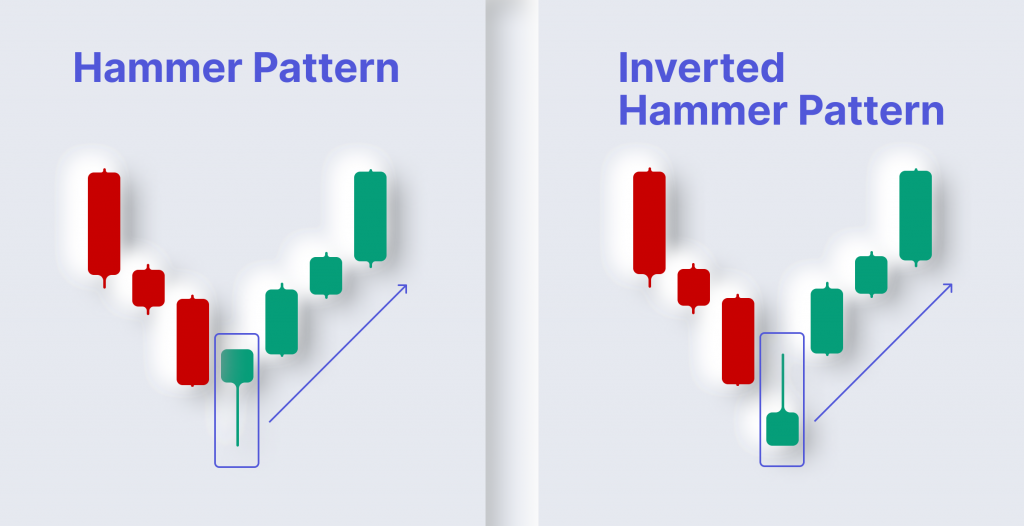
Hammer is a popular pattern in trading, and it can be easily identified due to its simple yet noticeable form.
Inverted Hammer
The Inverted Hammer pattern is similar to the Hammer pattern, with the only difference being that the Inverted Hammer is upside down. This pattern indicates the end of a downtrend and a possible trend reversal to the upside.
In the Inverted Hammer pattern, the upper shadow is longer than the lower one.
An inverted hammer candlestick pattern can be either green or red. A green inverted hammer indicates a stronger bullish sign than a red one.
This candle pattern is formed when the open, low, and close are approximately the same price. The pattern occurs at the bottom of a downtrend and indicates the rejection of lower prices at a specific level.
Bullish Engulfing
The Bullish Engulfing pattern is one of the most common patterns traders use. This pattern indicates the trend reversals after a pullback.
The valid Bullish Engulfing pattern consists of the first red candlestick and the second green one. The body of the green candlestick is much larger than the body of the red candlestick, with minimal overlapping shadows.
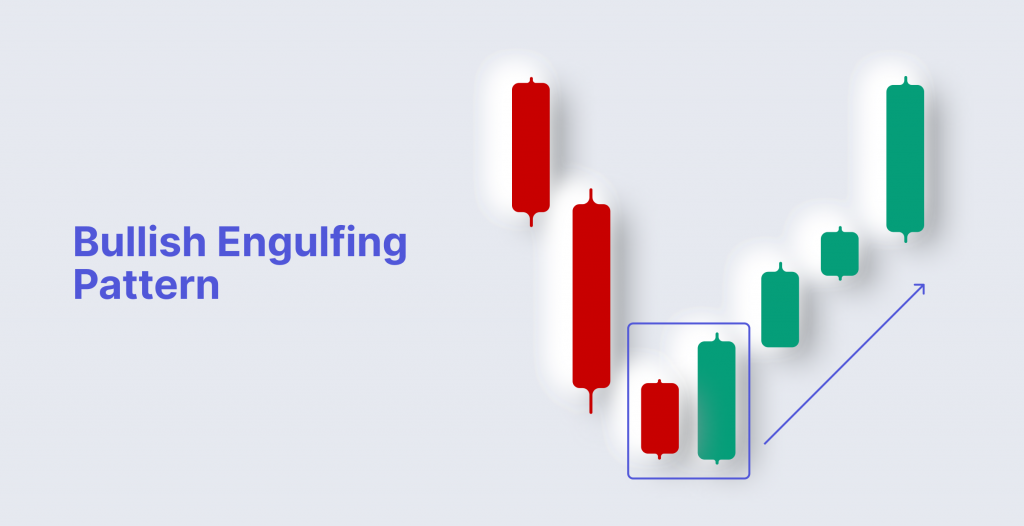
The bullish engulfing pattern indicates buyers have undertaken the market, and the price will likely increase.
An engulfing pattern represents a bearish and bullish trend and indicates trend continuation.
In a bearish pattern, the first candle is bullish, and the second bearish candle engulfs the first bullish one.
On the other hand, a bullish engulfing pattern consists of the first bearish candle bearish and the second bullish candle that engulfs the first bearish one.
A bearish engulfing line represents a bearish trend continuation, meaning a market price decrease. A bullish engulfing line, on the contrary, suggests higher prices to come.
Pin Bar
The Pin Bar pattern identifies possible trend reversals or continuations after a pullback.
This bullish candle pattern is identified by a long lower wick, a small body and a rather short upper wick.
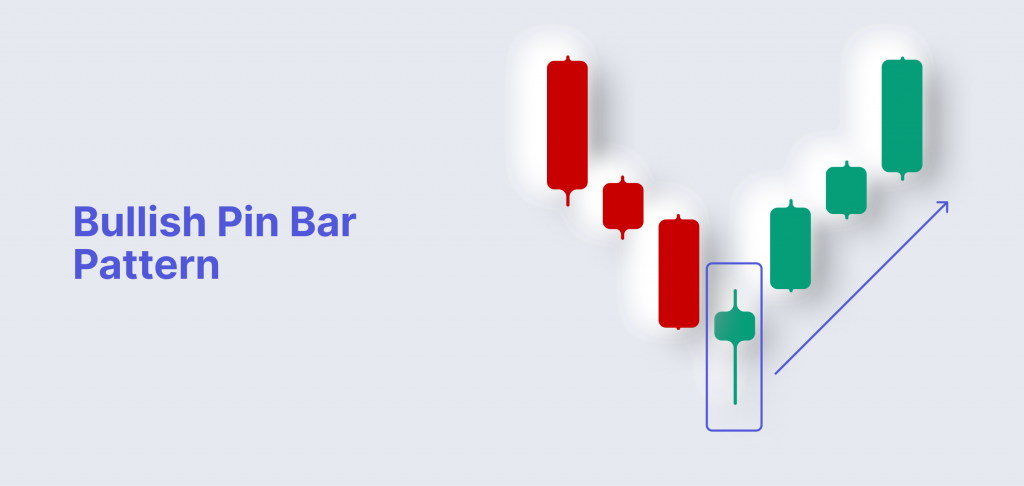
The pattern is valid if the lower shadow is at least two-thirds of the entire length of the candlestick.
Three White Soldiers
The Three White Soldiers pattern indicates that buyers are trying to raise the prices in the market. The likelihood of market consolidation or market pullback can be estimated by the size of the candle and the length of its shadow.
The pattern is a bullish reversal pattern; it consists of three green candles with small wicks, and each candlestick opens near the previous candlestick’s close price. This pattern is more reliable when it is formed in a downtrend that has been developing for longer.
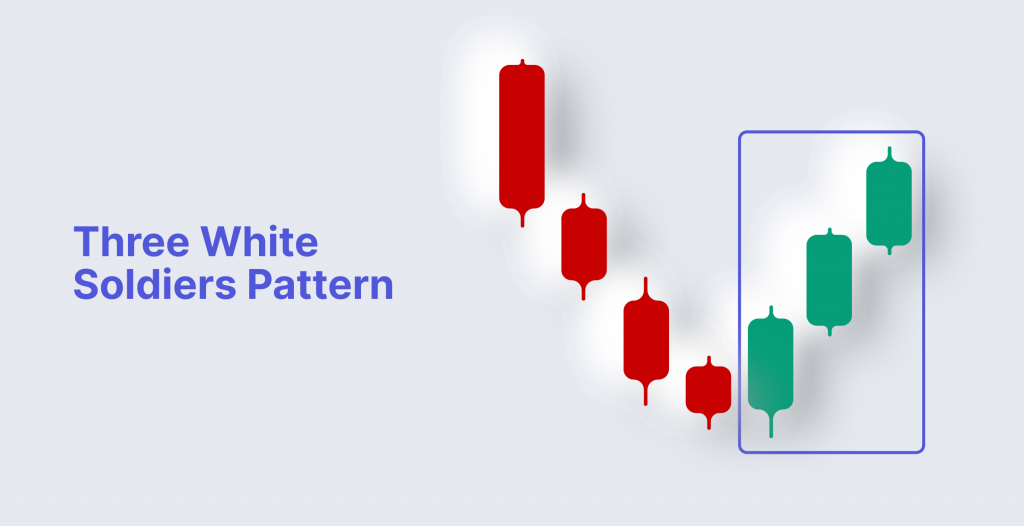
The Three White Soldiers pattern can be interpreted as a signal to enter long positions, expecting further price gains.
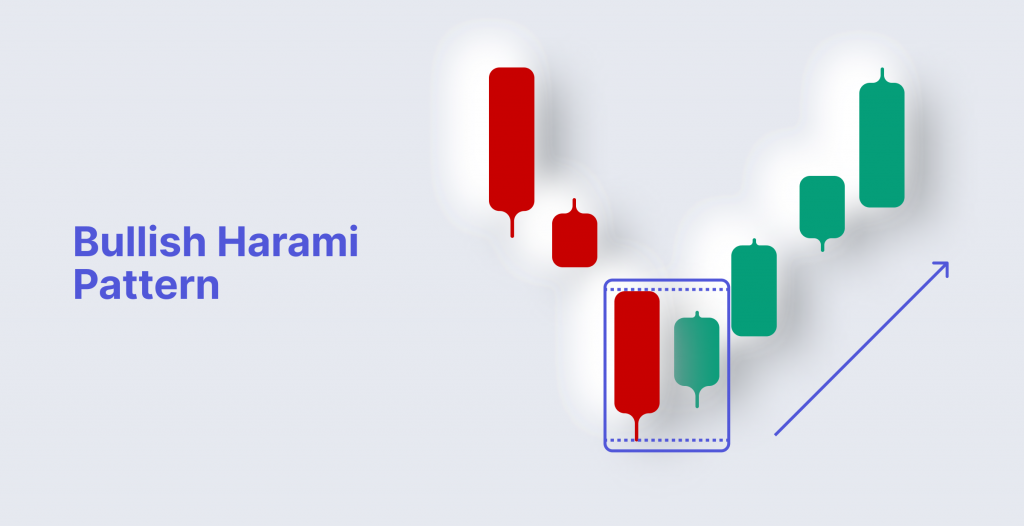
Bullish Harami
The Bullish Harami pattern can be formed within several trading days. The pattern notifies of a slowdown in sales and a potential reversal.
The Harami candle pattern is formed by two candlesticks: the first red candlestick has a long body and small shadows and is followed by the second green candlestick with a small body.
Morning Star
The Morning Star pattern is commonly interpreted as a signal to buy, implying that the price will likely rise soon.
The pattern is formed at the end of a downtrend and consists of three candlesticks:
The first candlestick is a bearish one; it is characterized by relatively small shadows.
The second candlestick is formed at the lower end of the first candle and is characterized by a small body (either red or green) and short shadows.
The third candle is a bullish one. It indicates a possible reversal of a trend and intense buying pressure. The body of this candlestick must be at least the same size as the body of the first candlestick or bigger.
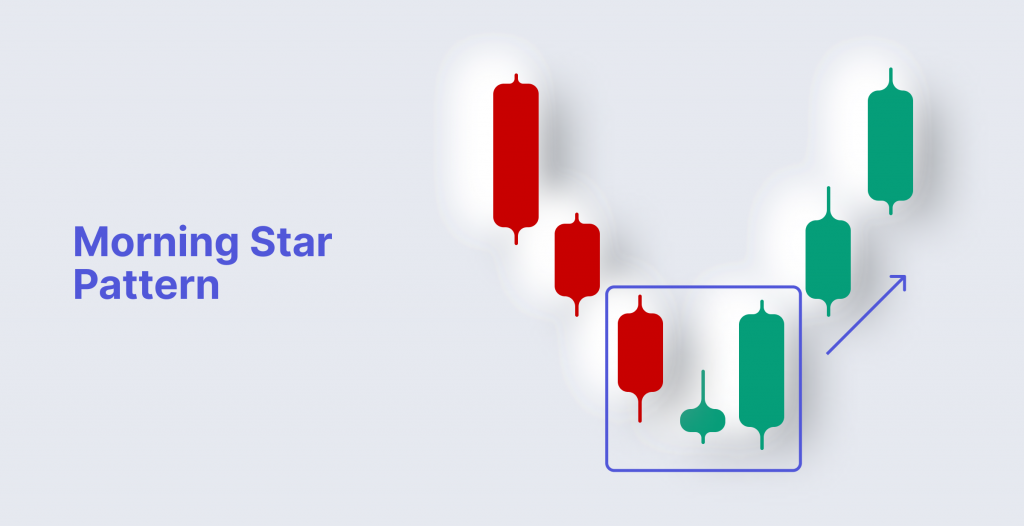
Candles on the edges of the middle candle should be significantly higher than the body of the middle one. At the same time, the central candle can open and close with a small gap.
Marubozu
The Marubozu pattern is a candlestick with a long body and no shadows. A bullish Marubozu candle is green, and it is the most accurate in trend continuations after pullbacks. It indicates that the market is trending in one direction.
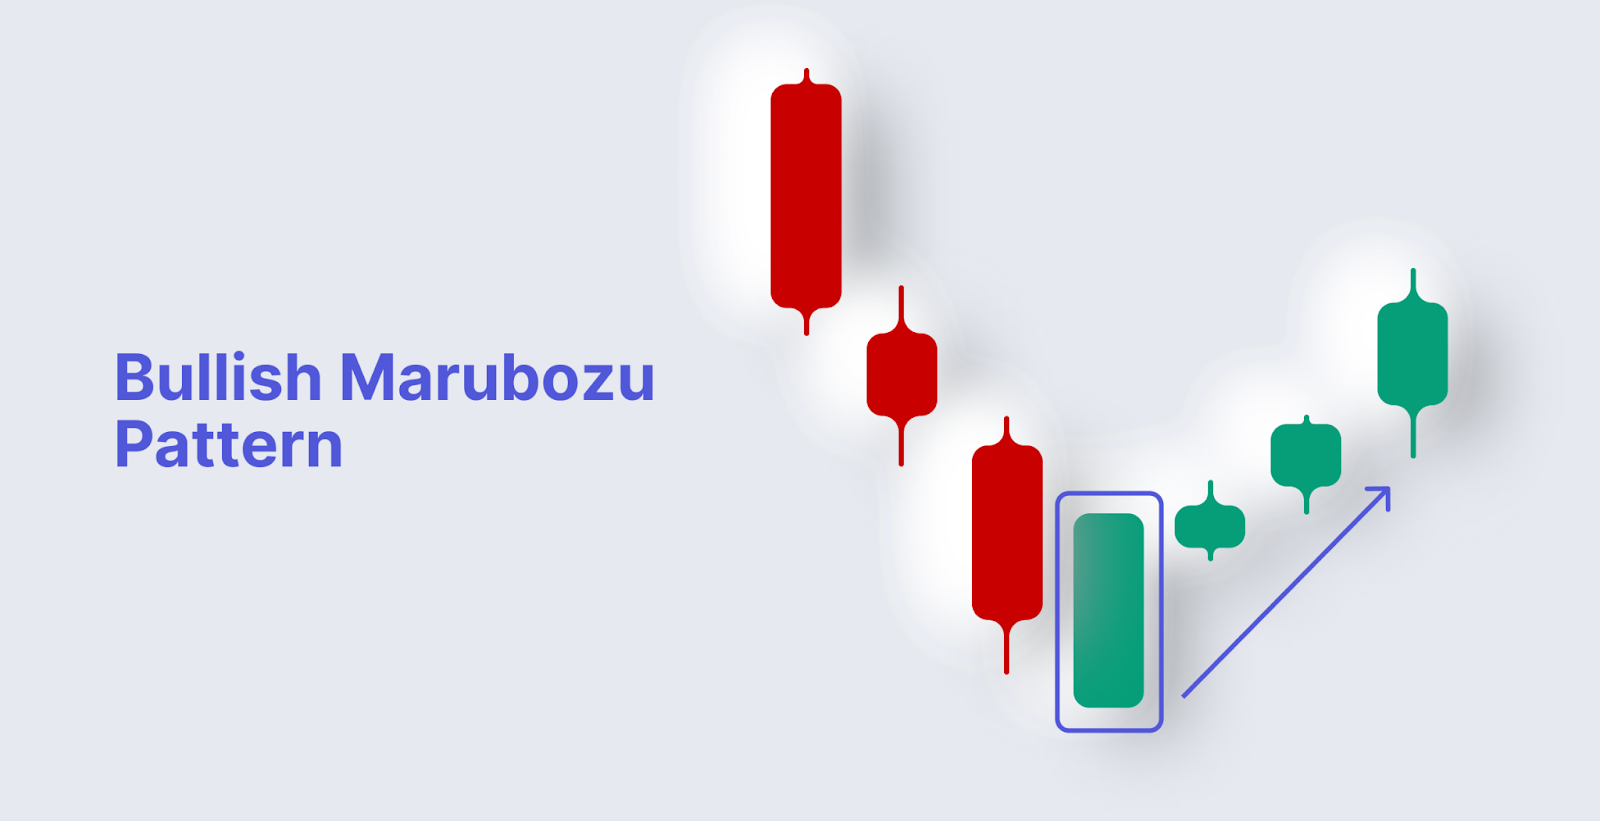
This candlestick shows that the market prices were controlled by buyers from the open to the close, indicating a bullish sentiment.
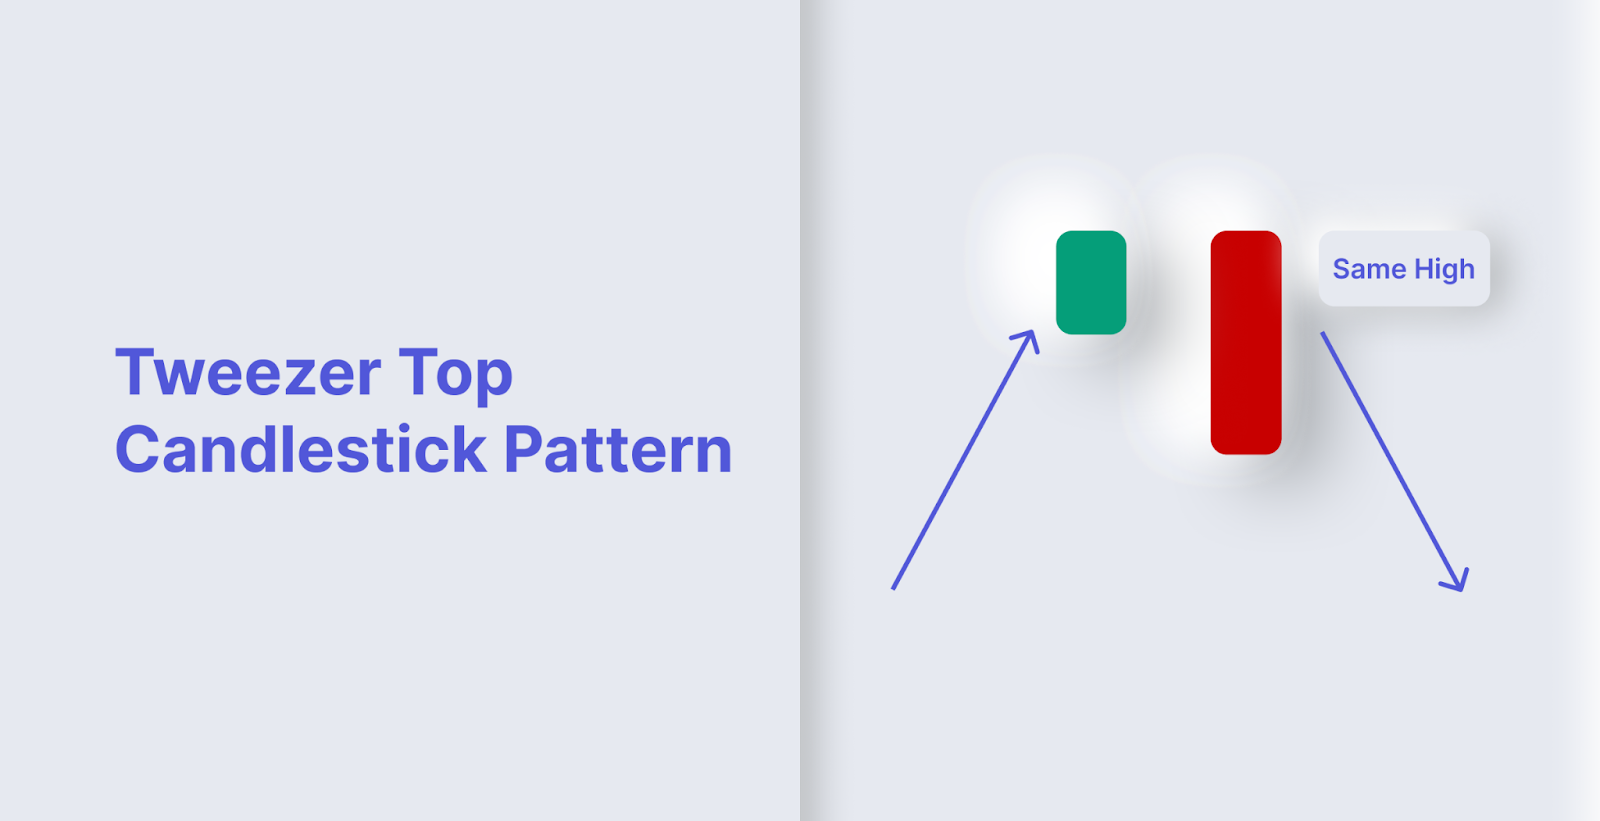
Tweezer Top and Bottom
The Tweezer pattern is a short-term reversal pattern.
It is formed of the two candle bodies of the same lows in a downtrend, or when the candlesticks have the same highs in an uptrend. The Tweezer pattern indicates buyer and seller competition and signals a probable trend reversal.
The pattern is named Tweezer Top if the market is in uptrend. It consists of two subsequent candlesticks of the same height. This pattern shows a market shift and a potential trend reversal since bears begin to take control of the market.
The pattern is referred to as Tweezer Bottom when the market is in a downtrend. In this case, the pattern comprises two subsequent candlestick bodies of either color that reach the same low point. Tweezer Bottom implies that buyers are entering the market since they pushed the prices up from the low point of the first candlestick.

Three Outside Up
The Three Outside Up is formed after a downtrend, indicating a bullish reversal.
As the pattern name suggests, the Three Outside Up bullish candle pattern comprises three candles: the first candle is a short bearish candle, the second candle is a large bullish candle that covers the first one, and the third candle is a long bullish candle with a higher close than the second candle.
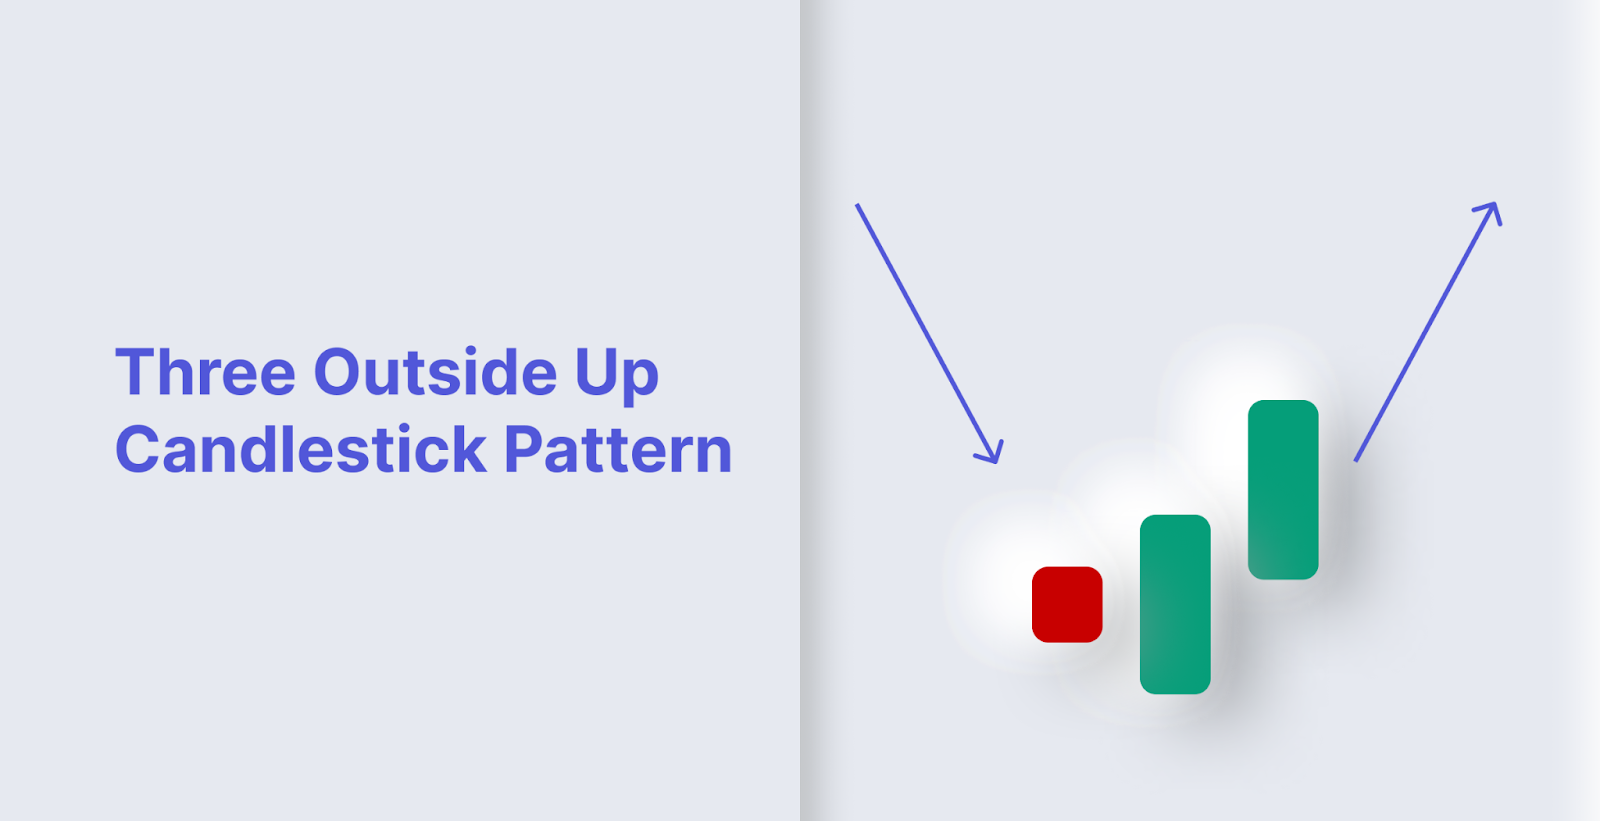
The Three Outside Up occurs frequently in the market. It is a reliable indicator of a market reversal. Traders use this indicator as a signal to take long positions; however, they still watch for more confirmations from other charts or technical indicators.
Conclusion
Both bear and bull markets can influence your investments, so understanding candle patterns and the ability to apply them and the profound knowledge of technical analysis can benefit trading. Candle charts provide an extra layer of analysis; however, they work best with other analysis tools, like analysis of support and resistance levels, trend lines, etc.
FAQs
What candlestick patterns are used for?
Candlestick patterns help traders identify potential trend reversals and confirm existing trends.
Is candlestick patterns a reliable tool?
Yes, candle patterns are a reliable tool for technical market analysis. The patterns are more reliable on higher time frames such as 1-hour, 4-hours, or daily since, in this case, there is less market noise. Candlestick patterns work best in combination with other analysis tools, such as moving averages, macd etc.
Do candle patterns work in all markets?
Yes. The patterns can work in any financial market, but their reliability depends on market players, timeframe, trading strategy and market volatility.


