
What Are Oscillators In Trading Analysis, And How To Use Them?
Visions of surfing without knowing when the next wave will crest or fall are common when you’re not using momentum indicators to trade. Meet oscillators, the trader’s best-kept secret to deciphering market rhythm, identifying overbought and oversold levels, and executing exact entries and exits.
Whether you’re a scalper, swing trader, or simply oscillator-inclined, this guide takes you through it all, from the fundamentals to pro tips for successful trading sessions.
Key Takeaways
- Oscillators show momentum extremes, making it easier for traders to spot overbought and oversold levels before price reversals.
- The oscillator creates upper and lower bands using extreme values in order to determine potential market overbought or oversold levels.
- They are most effective in sideways markets but can also be combined with trend-following tools in trending conditions, helping traders spot potential reversal points and improve trading signals.
- Popular tools like RSI, MACD, and Stochastic are used across all timeframes, including by day traders and oscillator trading bots.
What Are Oscillators in Trading?
As used in technical analysis, oscillators are technical indicators and can also serve as a trend indicator used by traders to determine when the asset could be overbought or oversold.
An oscillator is a line that oscillates between two extreme levels, providing a visual indication of momentum. Oscillators construct high and low bands between two extreme values, which help traders identify overbought or oversold conditions and make more informed trading decisions.
Think of it as being similar to a pendulum swinging between the extremes — whenever it veers too far to one side, generally, it means that a reversal or price correction is due to be on the way.
Oscillators are range-bound, oscillating between fixed levels, generally between -100 and +100 or between 0 and 100, depending on the tool being employed.
These fixed levels represent the low and high bands or extreme values that define the oscillator’s range. The ranges make it quicker and more straightforward for traders to identify turning points in the market.
For instance, when the oscillator reaches the upper boundary of the range, it can represent overbought levels and the impending pullback. The other time is when it reaches the lower boundary, and it can represent the condition of being oversold and hence can be used as a buying opportunity.
This is the opposite of trend-following signals, such as moving averages, which perform optimally when prices are consistently increasing or decreasing. Oscillators, on the other hand, excel in choppy or sideways markets — when there is no apparent trend, yet prices are moving within a regular band.
Though the trend-followers assist traders in “riding the wave,” the oscillators assist them in timing the wave, determining when the wave may be about to turn over.
Traders use oscillators primarily for momentum analysis. They’re not just interested in whether prices are going up or down but how strongly they move.
This insight is especially useful for catching early signs of trend reversals or diagnosing disparities between price and demand, which can lead to powerful trade setups.
Fast Fact
The MACD oscillator doesn’t use fixed overbought/oversold ranges like RSI — it measures the space between two moving averages, revealing momentum in trends.
How Oscillators Work?
To understand how oscillators function, think about the market as a living, breathing system—prices don’t move in one direction forever. They surge, slow down, pause, and then reverse. Oscillators help us capture those rhythm changes by analyzing momentum and showing whether prices might be due for a shift.
Price Movement Within a Defined Range
Oscillators are premised on the concept that prices don’t increase or decrease forever but do tend to trade within a range for most of the time. Oscillator indicators construct a scale such as 0 to 100 or -1 to +1 and determine where the closing price is located within this scale according to recent performance.
This range provides traders with an organized method of gauging how far prices have moved from their recent average. Prices have moved strongly higher if the oscillator reading is at the upper end; at the lower end, they’ve declined sharply. It helps traders determine whether or not a move has the potential to be exhausted or is only beginning.
Mean Reversion Theory
One large concept behind oscillators is the mean reversion principle or the idea that prices will revert to their mean over time. Visualize a rubber band: the greater the stretch, the more it rebounds when it’s released.
Oscillators operate on the same logic. When prices move too far from their historical average, the oscillator signals that a reversal might be due. This doesn’t mean it will happen instantly—but it raises a red flag that things may be out of balance.
Typical Oscillator Ranges
Most oscillators stick to standard boundaries that make interpretation intuitive. For example, the RSI moves between 0 and 100, while the MACD histogram can swing above and below zero.
These clear-cut ranges help traders define what’s “normal” and what might signal a shift. For example, an RSI reading above 70 often indicates overbought conditions, while below 30 might suggest oversold territory.
Overbought and Oversold Disorders
So what do we mean by “overbought” and “oversold”? These are terms used to describe market sentiment extremes.
An overbought reading suggests buyers may have pushed prices too high or too fast. It doesn’t always mean a crash is coming, but it often implies that bullish momentum is fading and a pullback or sideways move could follow.
An overbought situation is the reverse—prices have fallen sharply, so sellers are running out of momentum. This can permit the buying, possibly reversing the trend direction down.
It’s important to remember: overbought doesn’t mean “sell now,” and oversold doesn’t mean “buy now.” These are signals, not commands. To confirm a high-probability trade, they work best with other tools, like trend lines, volume analysis, or candlestick patterns.
Most Popular Types of Oscillators
When it comes to trading, not all oscillators are created equal. Each one brings a unique formula and perspective to the table, helping traders spot potential reversals, gauge momentum, or confirm trade setups.
Many traders use multiple oscillators together to improve trading accuracy and reduce false signals. Additionally, some oscillators, such as harmonic oscillators, are designed to generate sinusoidal signals and are fundamental in trading strategies.
Let’s break down some of the most widely used oscillators, how they work, and what makes each one special.
Relative Strength Index (RSI)
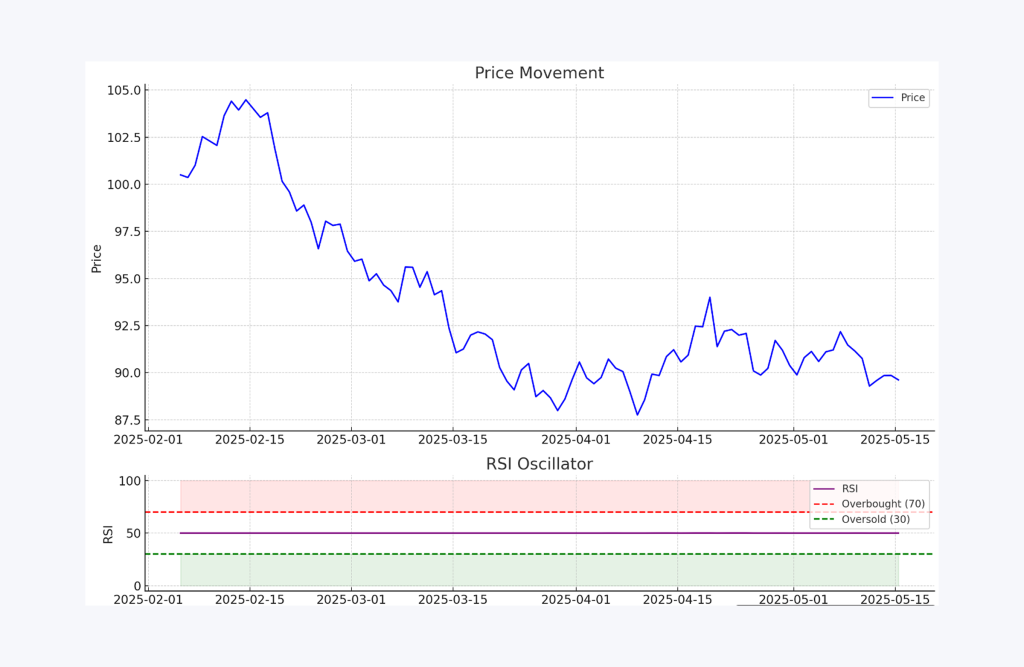
Perhaps the most widely used momentum indicator is RSI, which was devised by J. Welles Wilder. RSI helps traders figure out how fast and how far the price has traveled over the time considered — usually 14 periods.
The selected time period for RSI calculation influences how sensitive the indicator is to price changes and can affect the accuracy of overbought or oversold signals.
RSI values above 70 indicate overbought conditions, which can mean that a pullback is impending. Conversely, RSI values below 30 indicate oversold conditions, which can be indicative of an impending bounce.
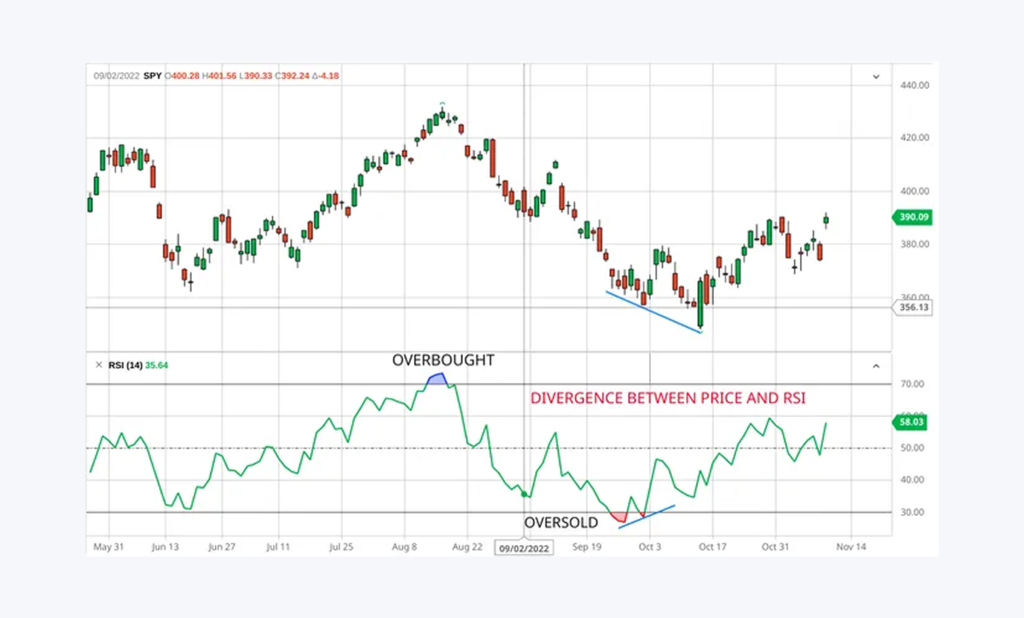
Traders love the RSI for its ability to catch momentum shifts, especially when paired with other tools like support/resistance or trendlines. It’s also valuable for spotting divergence — a scenario where the price hits a new high, but the RSI doesn’t follow. That kind of mismatch can be an early warning sign of a reversal.
Stochastic Oscillator
The Stochastic Oscillator looks at where the current price sits relative to its high-low range over a specific period, usually 14 sessions. It moves between 0 and 100, with readings above 80 signaling overbought conditions and those below 20 pointing to oversold levels.
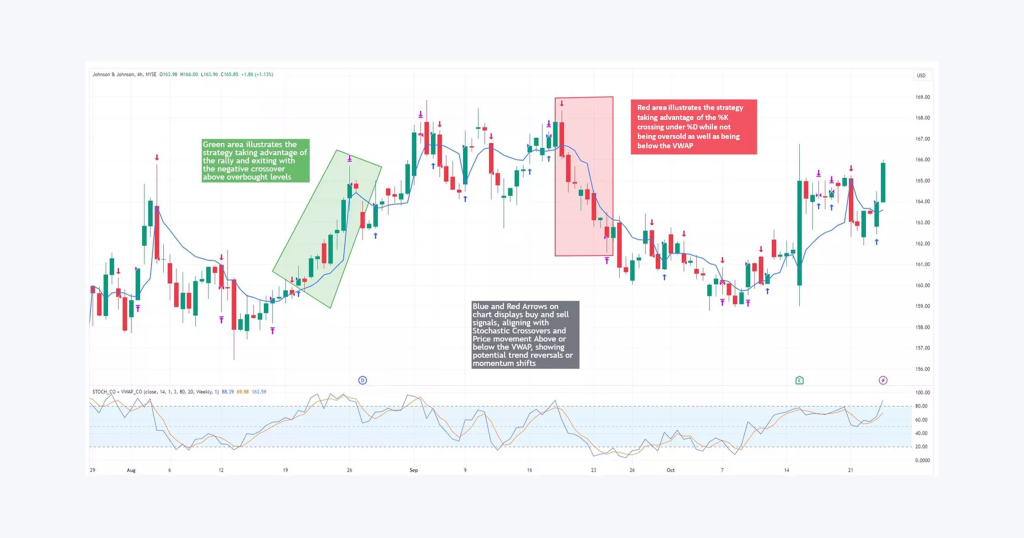
It uses two lines: the %K line (also called the K line, which is the faster line) and the %D line (a moving average of %K). The K line is key in generating buy signals and sell signals when it crosses the D line. When these lines cross, especially at overbought or oversold levels, it can be considered a sign of reversal of the trend.
Traders look for potential entry points when the stochastic indicator shows the K line crossing above the D line in oversold territory (buy signals) or crossing below in overbought territory (sell signals).
Stochastic is more reactive than RSI, which creates more signals—but also false signals. Hence, the traders prefer to see price action confirmation before participating.
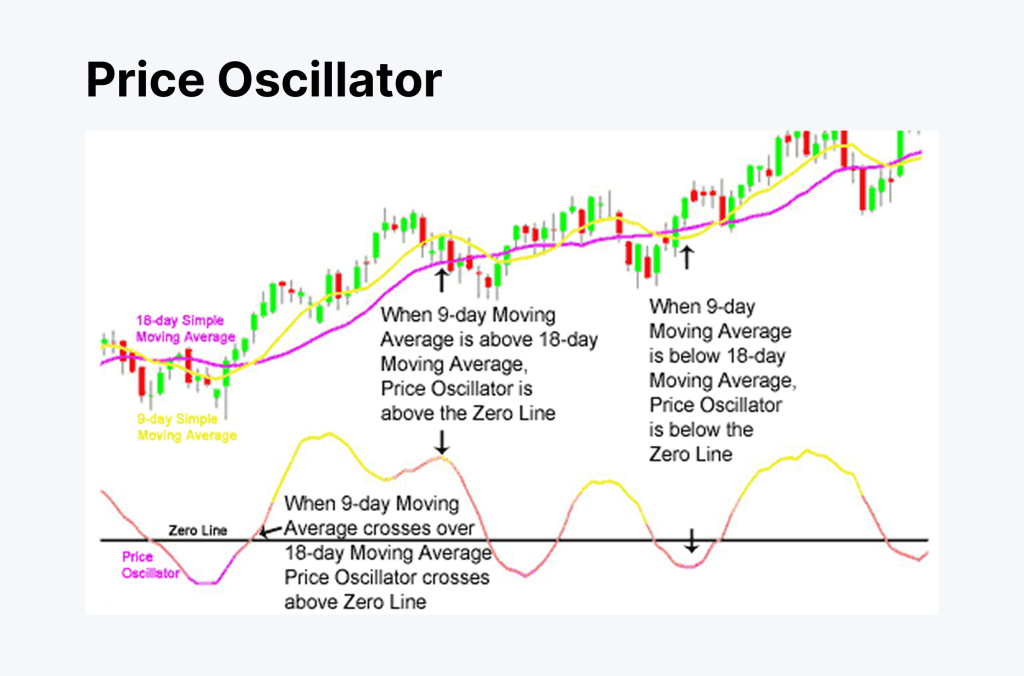
MACD (Moving Average Convergence Divergence)
MACD is unique as it is not tied to a fixed scale, unlike other oscillators. It instead takes the relationship between the 12-period and 26-period EMAs, and the discrepancy between them creates the MACD line, while the 9-period EMA of the line creates the Signal line. The histogram plots the area between the two.
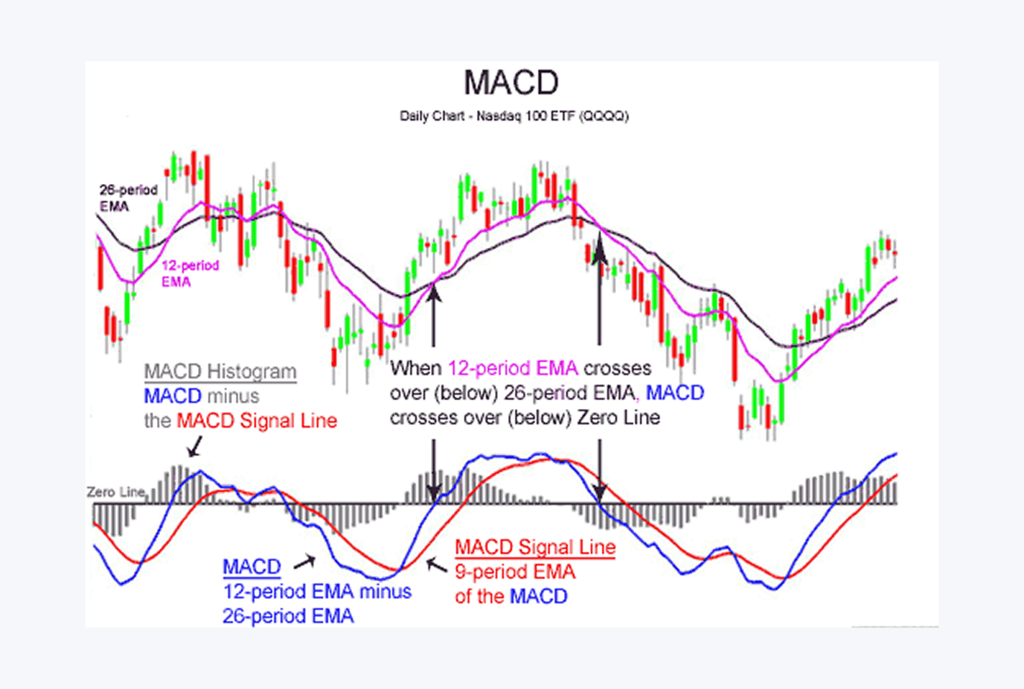
When the MACD line crosses above the Signal line, it’s considered bullish. When it crosses below, it’s bearish. These MACD crossovers are used by traders not only as entry signals but also as reliable exit points, especially in trending markets.
The histogram gives a visual cue about the strength of that momentum. Traders also watch for MACD divergence, where price and MACD move in opposite directions—a clue that the current trend might weaken.
Many traders combine MACD with other indicators to enhance signal reliability and reduce the likelihood of false signals.
CCI (Commodity Channel Index)
Despite its name, the CCI isn’t just for commodities. It measures how far the current price has moved from its historical average. While it doesn’t have a set upper or lower limit, values above +100 typically suggest overbought conditions, while those below -100 point to oversold territory.
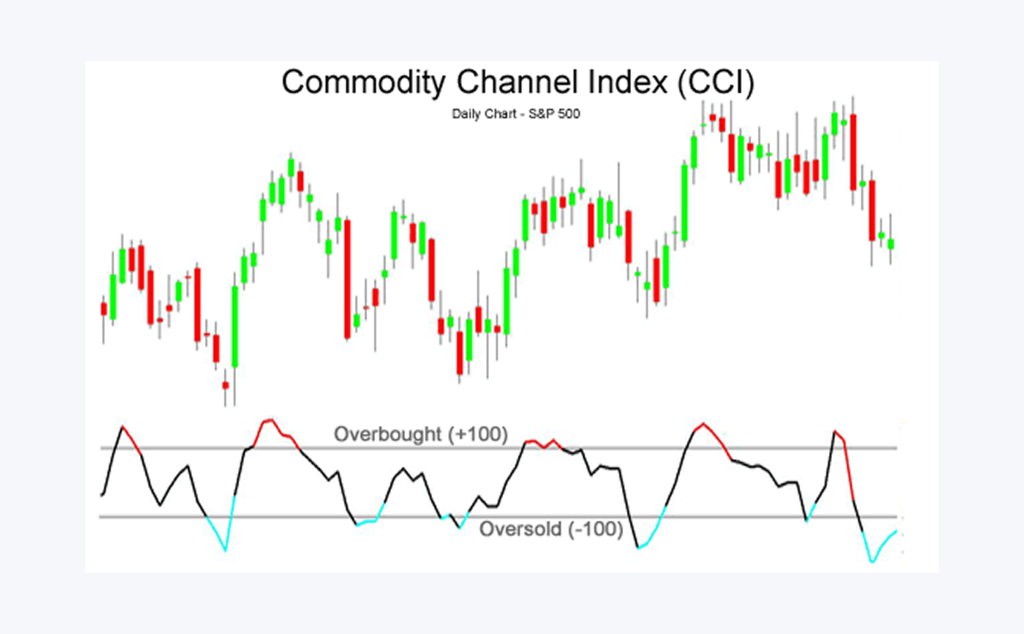
What makes CCI unique is its ability to track emerging momentum. It can move well beyond the usual thresholds in strong trends, so it’s often used for detecting reversals and verifying trend strength. Many traders use CCI with support/resistance levels or trendlines to increase accuracy.
Williams %R
The Williams %R oscillator is similar to the Stochastic but flipped upside-down, ranging from 0 (overbought) to -100 (oversold). It compares the final price to the high-low range over a specific period, typically 14 days.

The more the reading approaches 0, the more overbought the asset can be. At around -100, it’s probably oversold. Williams %R responds very quickly to price movements and is, as such, well-suited to short-term traders seeking instant signals in sloppy or ranging markets.
Williams %R is widely used in financial markets such as stocks, commodities, and forex to identify overbought and oversold conditions.
Rate of Change (ROC)
ROC is simply a momentum indicator that gauges the relative price change over a preceding period of time. It oscillates around a zero line—positions that are more than zero reflect bullish momentum, while positions that are less than zero reflect bearish pressure.
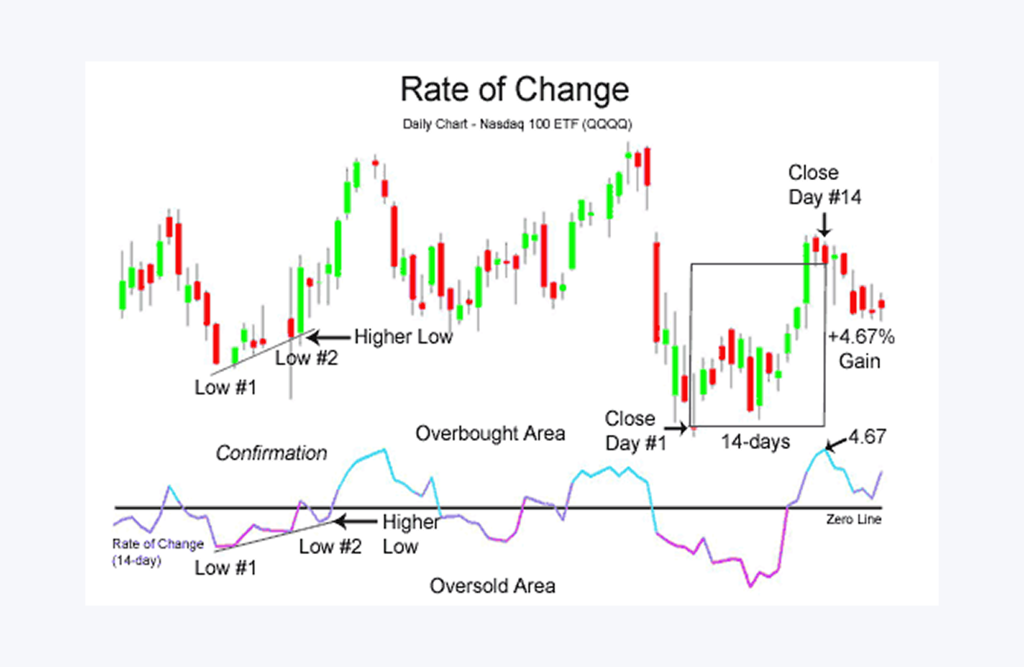
Traders use ROC to gauge trend strength and momentum shifts, often as a secondary confirmation tool alongside trend-following indicators. It’s useful for recognizing when an existing move is gaining or losing steam.
How to Use Oscillators in Trading?
Oscillators are powerful tools in the hands of informed traders. Many trading strategies incorporate oscillators to improve the timing and accuracy of trading decisions.
When used correctly, they help pinpoint trading opportunities with greater confidence. Oscillators are also valuable for identifying potential trend reversals by signaling when momentum is shifting.
Below, we outline the key strategies for utilizing oscillators effectively in real-world trading scenarios.
Assessing Overbought and Oversold Markets
The fundamental oscillator significance is tied to momentum — they indicate whether or not an asset is overbought or undervalued in the short term.
When traders call one stock “overbought,” they mean it has moved aggressively higher and could soon dip back down. “Oversold,” on the other hand, refers to an oversold condition, where technical indicators signal that an asset has been sold extensively, often implying a potential bounce or reversal.
Oscillators like RSI and the stochastic oscillatory systems have preset levels to flag these moments. For example, the asset might be overbought if the RSI is above 70. Below 30? It might be oversold. But don’t take these numbers as gospel — they’re signals, not certainties.
When an asset enters the overbought zone, traders often take it as a cue to lock in profits or consider short positions. Meanwhile, identifying oversold conditions can help traders time entries and exits more effectively, as an oversold reading may suggest a buying opportunity — but only if other factors support the trade.
Here’s where many newcomers trip up: just because something is overbought doesn’t mean it will crash. In strong trends, prices can stay “too high” or “too low” for much longer than expected. This is why experienced traders rarely rely on one signal alone.
Spotting Divergences
Divergence is when the values of an asset and its oscillator start telling different stories. If you’re into oscillators trading, this is a concept you’ll want to master.
A bullish breakdown happens when the asset price drops to new lows, but the oscillator forms higher lows. This disconnect often signals that bearish momentum is fading, and a reversal might be coming. These divergence patterns usually precede a trend reversal, alerting traders to a potential change in market direction.
A bearish divergence, by contrast, occurs when prices reach new highs, but the oscillator shows lower highs. That’s a warning sign — buying momentum could run out of steam.
Picture Bitcoin sliding to new lows while the RSI quietly climbs upward. That’s a bullish divergence. Or imagine Apple hitting new record highs while MACD or Stochastic begins to flatten or fall. That’s your bearish divergence.
These moments are subtle but often come before major trend shifts — making them gold for traders who know what to look for.
Implementing Oscillators with Other Tools
Let’s be honest: no tool works flawlessly in isolation. If you’re serious about trading oscillators, you need to consider them part of a bigger strategy — especially when using day trading oscillators in fast-paced environments.
Trend tools, such as moving averages, help define the broader market direction. When an oscillator shows oversold boundaries within a strong uptrend, that signal becomes more trustworthy. Similarly, Bollinger Bands reveal volatility. It might be a strong entry signal if the price hits the lower band while your oscillator is flashing oversold.
Volume is like the voice behind the price movement. If an oscillator gives a buy signal and volume spikes, that’s strong validation. Tools like On-Balance-Volume (OBV) or the Volume Oscillator are perfect companions to momentum metrics.
Even the best signals can be wrong. That’s why stop-loss orders and take-profit targets are essential. And remember: never risk too much on a single trade, especially when following short-term oscillator signals. Solid risk management is your safety net whether you’re trading manually or using oscillator trading bots.
Timeframes and Market Types
Not all oscillators behave the same across specific timeframes. If you’re into day trading oscillators, you’ll likely lean on fast-reacting tools like the Stochastic Oscillator on 1-minute to 5-minute charts. These give quick signals, but they can also be noisy.
On the other hand, swing traders often use RSI, MACD, or CCI on 4-hour or daily charts, where the noise is lower and the signals more meaningful.
Many traders use the daily chart as a key reference for confirming oscillator signals and identifying longer-term trends. Long-term investors may use weekly or monthly oscillators to spot bigger trend reversals or time their entries during market corrections.
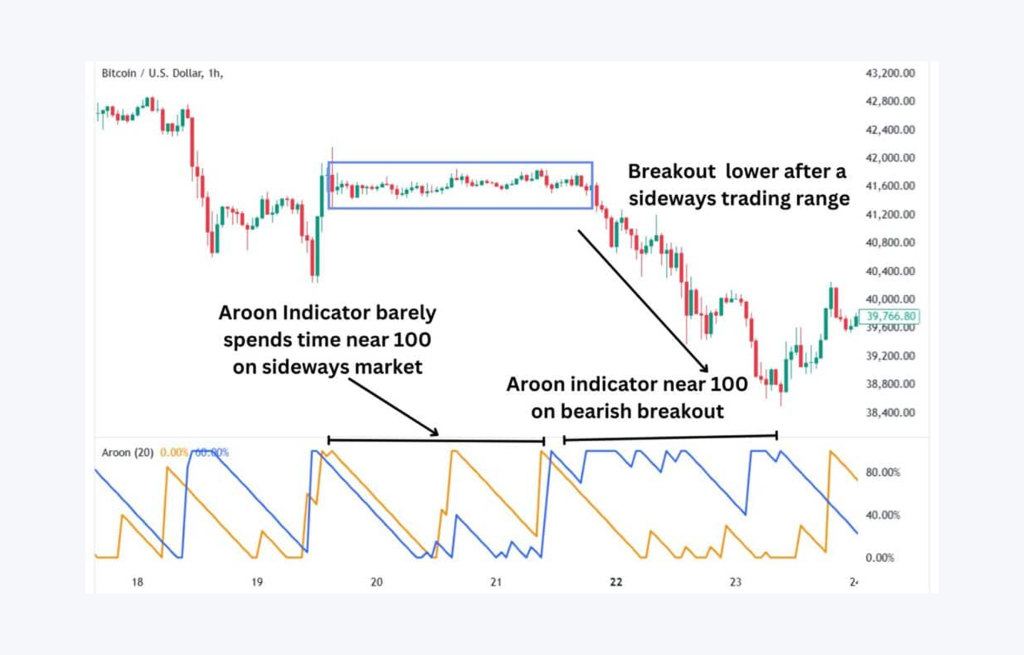
Oscillators perform best in sideways markets, especially when there is no clear trend and stock trades horizontally or in a range, with prices bouncing across support and resistance. In those conditions, the classic approach works beautifully: buying oversold/overvalued and selling overbought.
But in strong trending markets, they can be misleading. For instance, an asset might stay “overbought” for weeks in a powerful uptrend. That doesn’t mean it will drop — it may just keep climbing.
Always use trend confirmation tools before acting on oscillator signals to avoid falling into that trap. In trending environments, it’s often smarter to only take trades in the direction of the trend — like buying on dips during an uptrend.
Conclusion
Oscillators aren’t magic—but in the hands of a skilled trader, they come pretty close. They don’t just tell you where the market’s been—they hint at where it might go next. Whether riding trends or playing reversals, mastering oscillators can turn market noise into meaningful signals.
From subtle divergences to bold breakouts, they help decode momentum as few other tools can. So plug them into your charts, pair them with solid strategies, and let them guide your next winning move.
FAQ
What is the meaning of oscillators in trading?
Oscillators measure market momentum and signal when assets may be overbought or oversold.
Which oscillator is best for day trading?
Day traders often favor the Stochastic Oscillator for its speed and sensitivity on shorter timeframes.
Can oscillator trading bots be reliable?
Yes, when properly configured with risk controls and signal confirmation, bots using oscillators can automate efficient entry and exit points.
Are oscillators better in trending or ranging markets?
They work best in ranging markets but can also support trend trades when combined with confirmation tools.
How many oscillators should I use at once?
Typically, one to two oscillators are sufficient. More can cause signal conflicts or confusion.


