
What Is an Ethereum Rainbow Chart and How to Read It?
There are two types of players in financial markets: short-term speculators and long-term holders. While speculators focus on trading volumes, a significant number of investors, or HODLers, strategically buy cryptocurrencies like Ethereum or Bitcoin during bear markets, aiming to hold them for extended periods and sell at the very top.
Today, timing the market becomes crucial for both of these groups, especially with the recent volatility and price fluctuations, when BTC potentially starts a new bull run, rising from $27,000 to $36,000 in just one month, and occurrences like the largest coin falling about $1000 in just one hour.
So, how do you define optimal entry and exit points for your investments? To navigate these highs and lows effectively, many rely on various tools and models, including the Ethereum Rainbow Chart. This guide will explore how this indicator works and why it is crucial for understanding Ethereum’s long-term price trends.
Key Takeaways:
- The Ethereum Rainbow Chart is a graphical representation of the ETH price levels.
- Each color represents a certain price level – from red (the market is overpriced) to blue (the market is undervalued).
- The Ethereum version of the indicator was created after that of Bitcoin.
- The chart does not guarantee the same future results and does not take into account factors besides historical price data.
What is the Ethereum Rainbow Chart?
Among the many digital currencies available, Ethereum stands out as a popular form of speculative asset and a platform for smart contracts and decentralized applications (dApps). As the demand for decentralization continues to grow, so does the potential for Ethereum. Thus, this project has promising prospects for future growth.
However, predicting the price of this coin and making investment decisions can be tricky and risky, as always in any type of market with every instrument.
To assist investors in understanding Ethereum’s market trends, there is an Ethereum Rainbow Chart. This indicator uses a logarithmic growth curve to showcase the long-term exponential price development of Ethereum. It also includes colored bands and layers representing different price levels of ETH, making it easier for traders to interpret and analyze data.
Utilizing the ETH Rainbow Chart empowers investors with insights on optimal buying and selling points, whether to hold or increase holdings and how to avoid succumbing to FOMO (fear of missing out) or panic selling.
How the Ethereum Rainbow Chart Was Born
The concept of the rainbow chart for a cryptocurrency can be traced back to 2014. It was first created by a Reddit user, ‘azop‘, who envisioned it as a humorous depiction of Bitcoin’s price history.
However, what started as a simple joke soon gained traction and became a decision-making tool for traders and investors.
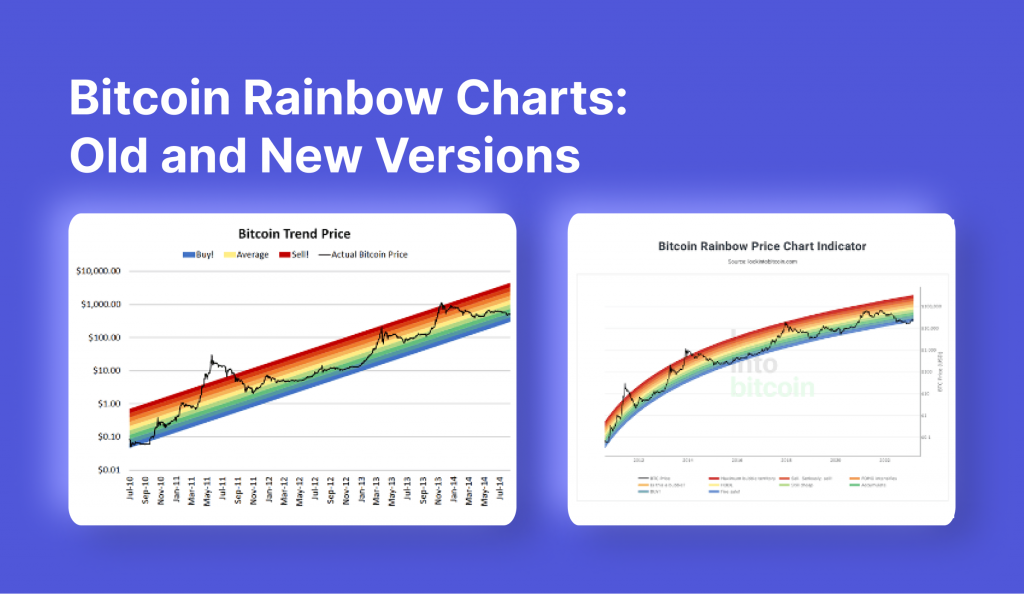
The original version of the Rainbow Chart was based on a linear regression model, which provided a visual representation of Bitcoin’s price movement over time. But as the cryptocurrency market grew and evolved, so did the Rainbow Chart.
Later, another user, ‘trolololo’, took it and improved the chart’s accuracy by incorporating logarithmic regression. This new version reflects the natural deceleration of growth in Bitcoin, where it takes an increasing amount of capital to push the price higher.
In 2020, the chart gained more attention when it was revived by Nic Carter and Eric Wall. During this time, the model faced criticism from some for its simplicity. However, the BTC Rainbow Chart held up well until the recent drop in Bitcoin price, prompting its original creator to discontinue its use. But instead of completely letting it die, a compromise was made by adding an indigo color to the chart on the low level.
The success of the Bitcoin Rainbow Chart led to its adaptation for other cryptocurrencies, with Ethereum receiving its own version. And just like its predecessor, the Ethereum Rainbow Chart continues to recalibrate based on new price information, making it even more accurate over time.
Reading the Ethereum Rainbow Chart
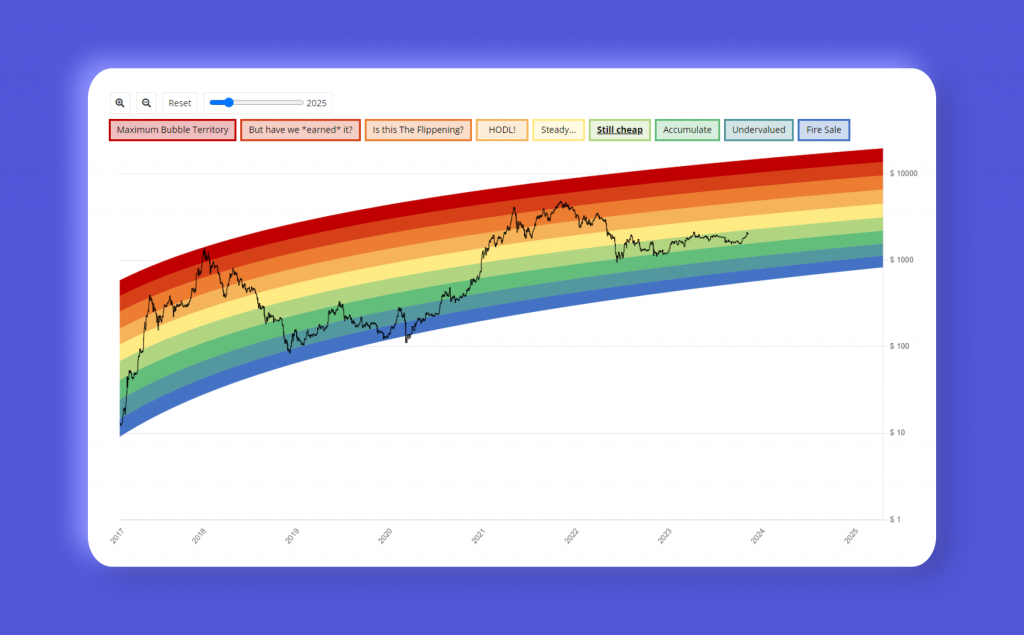
The Ethereum Rainbow Chart uses a color-coded system to help indicate potential opportunities. Each color represents a different price range and comes with its own set of recommendations. Let’s take a closer look at what each color on the chart means and how you can use this information to your advantage.
- Blue: This is the bottom of the price range, indicating a rare opportunity to buy Ethereum at a very low price. It is often seen as a good entry point for new traders looking to invest in ETH.
- Light Blue: This color indicates that Ethereum is still undervalued and presents a favorable buying opportunity.
- Green: This tone signifies that the price of Ethereum is within a reasonable range for accumulating more tokens. It is best suited for traders who are not deterred by short-term fluctuations and believe in the long-term potential of ETH.
- Light Green: Similar to the previous color, this indicates a good time to buy Ethereum at a relatively low price.
- Light Yellow: This level is associated with a period of time when many traders choose to hold onto their Ethereum rather than buy or sell. It is often seen as a neutral zone, signaling uncertain market conditions.
- Yellow: When the price of Ethereum approaches this range, it may indicate that ETH is becoming overbought. This can make it difficult for traders to determine whether to buy or sell.
- Orange: As the market moves into this level, traders may experience FOMO and be tempted to buy at high prices. It is important to be cautious in these situations and not let emotions drive your trading decisions.
- Red: It indicates that the price of Ethereum is overpriced and may soon experience a decline. Traders should consider taking profits and exiting their positions at this point.
- Magenta: As the highest range on the rainbow chart, this color signifies that the price of ETH is in a bubble zone and may soon experience a significant drop. Traders should exercise caution and consider selling their holdings before it’s too late.
Utilizing the Ethereum Rainbow Chart for Price Predictions
The Ethereum Rainbow Chart serves as a visual reference point for traders to compare the current price of Ethereum with past price trends. It helps identify potential future price movements under the assumption that market cycles tend to repeat themselves.
While many may view the Rainbow Chart as a crystal ball that can predict exact prices, it is important to note that this is not its intended purpose. Instead, it offers a broad perspective on Ethereum’s price performance, taking into account the cyclical nature of markets.
The Flaws of the Ethereum Rainbow Chart
While the crypto rainbow chart provides valuable insights into historical price trends, it has certain flaws that traders should be aware of:
Price Data Alone Cannot Tell the Whole Story
One of the main flaws of the Ethereum Rainbow Chart is that it solely relies on price data for its analysis. While this can provide valuable information, it does not take into account external factors that can significantly impact the market. For example, governmental regulations and economic conditions can greatly affect the price of Ethereum, but these cannot be accurately reflected in the chart’s historical data.
Neglecting Network Developments
Another crucial aspect that is not incorporated into the Ethereum Rainbow Chart is current and future developments within the network itself, like an Ethereum 2.0 upgrade or sharding network updates.
Limited Timespan Can Lead to Inaccuracies
Compared to the Bitcoin Rainbow Chart, which shows the price starting with 2010, the Ethereum Rainbow Chart spans from 2015, a much shorter period of time. This limited historical data may result in potential inaccuracies in predictions and analyses.
Use the Chart with Caution
While the Ethereum Rainbow Chart gives valuable insights, it should not be used as the sole basis for making informed investment decisions. Use other technical analysis tools and research extensively to gain a comprehensive understanding of the market before making any trades. This will help mitigate the limitations of the chart and provide a more well-rounded approach to trading.
Why the Ethereum Rainbow Can Be a Valuable Part of Your Trading Toolbox
The ETH Rainbow Chart remains a valuable tool for assessing market sentiment. Here are some reasons for this:
Simple Visualization of Market Sentiment
One of the main advantages of using the Ethereum Rainbow Chart is its simplicity. The chart uses a rainbow color scheme to represent different price levels, making it easy for traders to visualize market sentiment at a glance.
A Window into Future Price Movements
While the Rainbow Chart does not provide exact predictions, it still offers some potential insight into future price movements. For example, it usually predicts when the coin is overbought and when the market is wanting to buy heavily, which helps swing traders make profitable trades.
One of the Many Tools in Your Trading Strategy
In the fast-paced world of cryptocurrency trading, having a diverse set of tools and strategies is key. The Ethereum Rainbow Chart offers a unique perspective that complements traditional technical analysis methods such as support and resistance levels or moving averages.
Closing Thoughts
The Ethereum Rainbow Chart is a valuable technical tool for analyzing Ethereum’s price past performance and historical trends. However, it is important to remember that the Rainbow Chart should not be solely relied upon for making trading decisions. It should be used in conjunction with other technical analysis tools and thorough research. While the chart does not provide exact price predictions, it offers an overall visual display of Ethereum’s price changes and potential future trends.
Disclaimer: The information provided in this article is for educational purposes only and should not be construed as investment advice. Always conduct your own research and consult with a professional before making any investment decisions.
FAQs
Is the Ethereum Rainbow Chart accurate?
The Ethereum Rainbow Chart, like any other technical analysis tool, is only sometimes accurate. Its historical data is based on past performance, which, as we know, is not always indicative of future results. Therefore, it should be used as a guide and not the sole factor in making investment decisions.
Will Ethereum go to zero?
While the possibility of any cryptocurrency going to zero cannot be ruled out, it is highly unlikely for a well-established and widely adopted cryptocurrency like Ethereum. Several factors contribute to this, such as its strong network effect, widespread use cases, and continuous developments in technology.
One of the key reasons why Ethereum is unlikely to go to zero is its strong network effect. The more users and developers adopt Ethereum, the more valuable it becomes as a network. This creates a positive loop, making it difficult for Ethereum to lose its value entirely.
Additionally, Ethereum has a wide range of use cases beyond just being a form of currency. It is also used for smart contracts, DApps, and even as a platform for creating other tokens. This diversity in use cases makes Ethereum a versatile and resilient network that is not solely dependent on its value as a currency.
Is ETH about to go up?
Over the past few months, there has been a lot of speculation surrounding Ethereum and its potential for growth. The recent news of BlackRock Advisors registering an iShares Ethereum Trust has caused even more excitement and speculation in the crypto community.
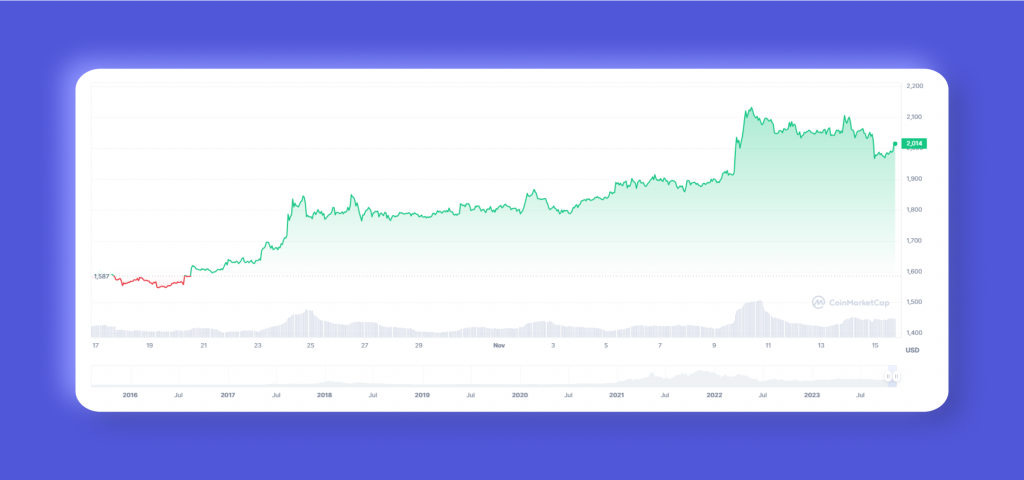
The price of ETH broke through $2,000 in November and has continued to trade above that level. This surge in price has been attributed to the news of BlackRock Advisors, as it is seen as a sign of institutional adoption and investment in Ethereum.
Also, ETH follows Bitcoin’s lead in terms of price movements, and with Bitcoin reaching new highs recently, many are speculating that ETH may follow suit.
Furthermore, the decentralized finance market has seen rapid growth on the Ethereum blockchain, which has added to its value proposition. As DeFi continues to gain mainstream attention and adoption, ETH will likely see increased demand and, therefore, a rise in price.
Is ETH a good investment?
This is a difficult question, as it ultimately depends on an individual’s risk tolerance and investment strategy. However, several factors certainly make ETH a compelling investment opportunity.
Firstly, Ethereum is the second-largest cryptocurrency by market capitalization, making it a well-established and trusted player in the crypto space. This provides stability and credibility compared to newer and smaller cryptocurrencies.
Secondly, as mentioned earlier, Ethereum has a wide range of use cases beyond just being a form of currency. This diversity makes it more resilient and less dependent on its value as a currency, making it a safer long-term investment.


