
XRP’s 24-Hour Price Dip Raises Concerns for Bullish Investors
The price of XRP has been moving in a narrow sideways pattern for more than a week, trapped between two converging trendlines. This period of consolidation followed a significant surge in value on July 13th, intended to stabilise the price and extend the positive trend. However, the recent breakdown below the support trendline suggests that the fourth-largest cryptocurrency may require a more extended correction period.
Overview of XRP Daily Chart
Court’s non-security ruling boosts XRP’s appeal, hopeful for a rally above $1 towards 2018’s high. Yet, a 10% drop follows due to a broken support trendline. $0.669 becomes a robust demand zone. Trading volume rises by 27%, drawing investor attention to prospects.
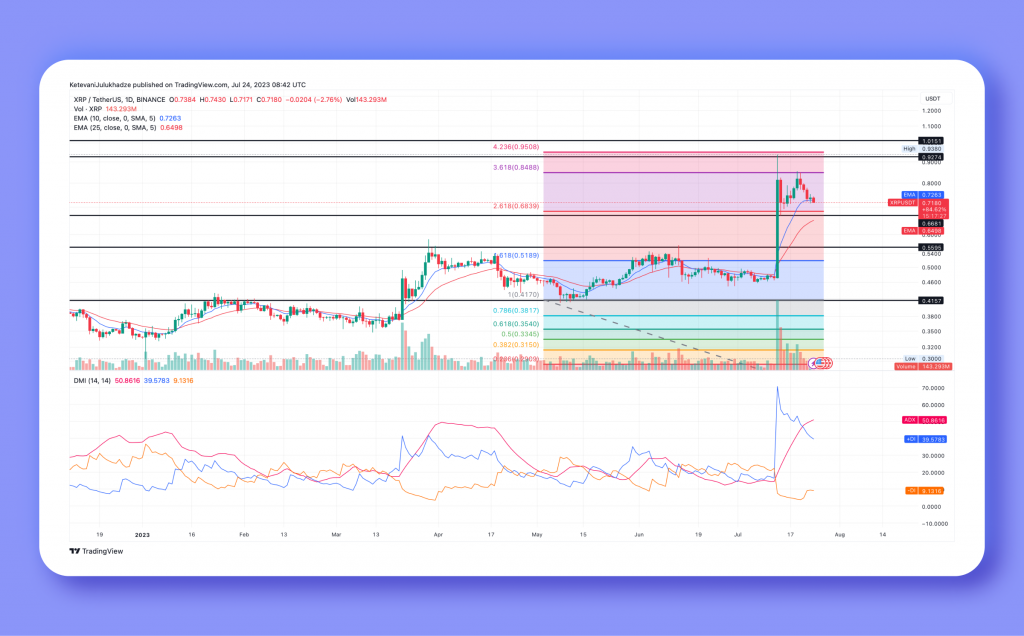
The bearish outcome arising from the previously bullish pattern serves as a robust sell signal, signalling the possibility of an impending downturn. As of the current press time, XRP is trading at $0.71. Despite this, a bullish uptick could prompt a retest of the breached trendline, allowing for an assessment of the price’s suitability for potential lower levels. Investors closely monitor these developments to gauge the market’s direction and make informed decisions accordingly.
XRP’s Potential Retreat to $0.6 – Market Sentiment Analysis
The XRP price may decline to $0.669, where it is expected to encounter strong support aligned with the 50% Fibonacci retracement level. In technical analysis, a correction of 50% is considered to be a healthy and suitable development to maintain the prevailing bullish trend. However, a breakdown from this support level led to an 8.6% plunge in the price. Subsequently, the XRP price tested the combined support at $0.6 and the 61.8% Fibonacci retracement level. Investors and analysts closely monitor these price movements to assess the market’s direction and potential future trends.
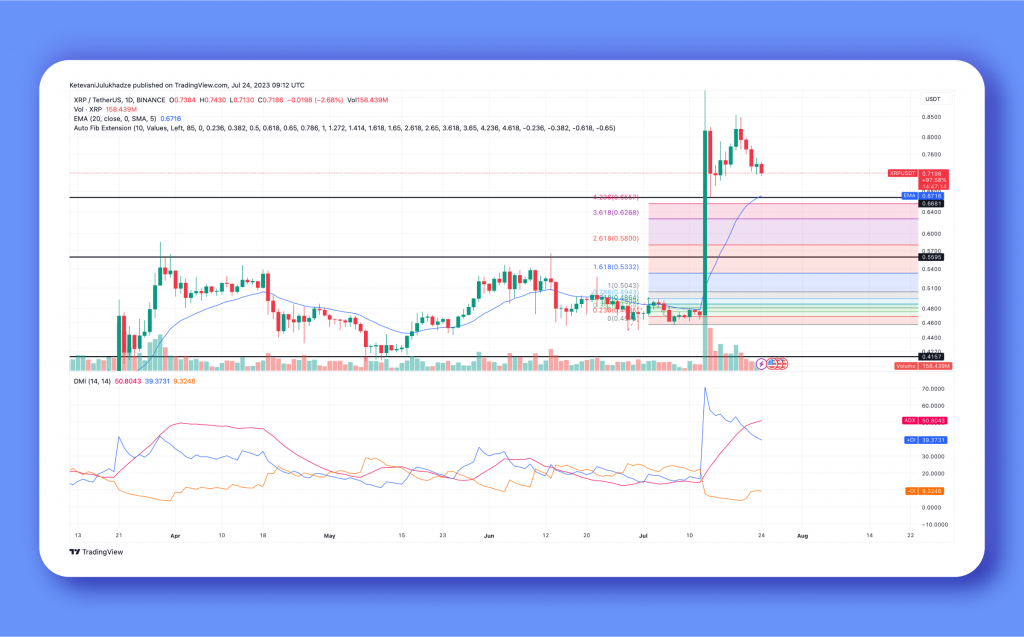
- The 20-day Exponential Moving Average (EMA) at $0.669 enhances the support strength of this level.
- The Directional Movement Index (DMI) shows a significant gap between the positive crossover state of the DI+ (blue) and DI- (orange) slopes, indicating the bullish momentum remains intact.


