Four Key Factors Shifting Ether’s Breakout Beyond $1,970
The recent price rally of Ether has encountered a setback as the Ethereum network witnessed withdrawals from its smart contract applications.
Despite reaching the $1,970 level on July 3, the price of Ether faced resistance and struggled to surpass this threshold. Several factors contributed to capping the rally, including the increased likelihood of future interest rate hikes and a more stringent regulatory environment surrounding cryptocurrencies. These elements have collectively impacted the ongoing price dynamics of Ether.
Challenges From Federal Reserve’s Financial Policies
The Ethereum network has faced challenges from external factors and withdrawals from its smart contract applications.
These factors have contributed to a possible correction in Ether’s price, potentially dropping to the $1,700 level last seen on June 16th. With the fading tailwinds from the request for a Bitcoin exchange-traded fund, investors now question the future trajectory of Ethereum.
Recent macroeconomic events, such as the growth in the US gross domestic product, the increase in Germany’s Consumer Price Index, and the expansion of activity reported by China’s Caixin Global purchasing managers’ Index, may provide some hints in understanding the current situation.
The recent surge in strong economic indicators has raised investor expectations of further tightening measures from the U.S. Federal Reserve. This sentiment has been reinforced by Fed Chair Jerome Powell’s suggestion of two additional interest rate hikes in 2023, alongside the growing cost of capital and higher returns offered by fixed-income investments. Consequently, the appeal of cryptocurrencies has diminished in the eyes of investors.
Turning to regulatory developments, two noteworthy events have captured attention.
Firstly, on June 28, European Union lawmakers proceeded with the controversial Data Act, which introduced requirements for smart contracts, including the implementation of kill switches for safe termination and rules governing data sharing.
Secondly, on July 4, local authorities searched Binance Australia’s corporate offices as part of an ongoing investigation into its derivatives business, which had its license revoked in April 2023. These regulatory developments have further influenced the cryptocurrency landscape, shaping market perceptions and actions.
Decreased Network Demand Pushes TVL to Near Three-Year Lows
The Ethereum network is currently confronting its own challenges, notably highlighted by co-founder Vitalik Buterin’s statement on June 29 regarding his decision not to stake all of his Ether. This choice stems from the complexities associated with multi-signature wallets.

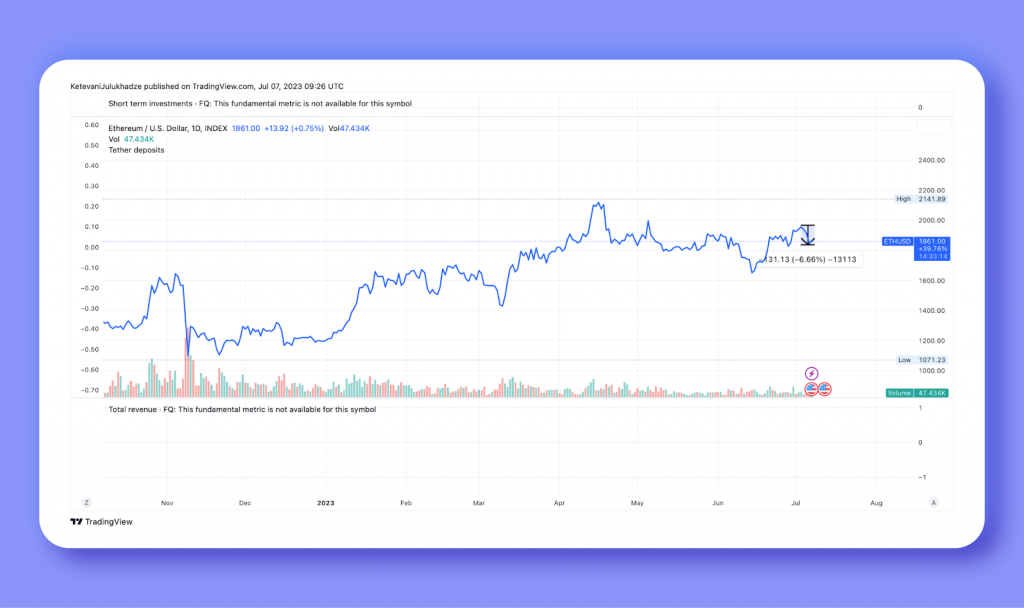
Additionally, the total value locked (TVL), metric gauges the deposits locked in Ethereum’s smart contracts, has recently hit its lowest since August 2020. Over the 30 days leading up to July 4, the TVL witnessed a decline of 6.6%, as reported by TradingView.
A decrease in TVL signifies that either investors are losing interest in utilizing smart contracts on the network or have shifted towards layer-2 alternatives in pursuit of lower transaction fees. Regardless, this decline in potential demand for the Ethereum network is seen as a bearish signal.
Ether’s Price Surge Driven by Increasing Leveraged Long Positions
The analysis of professional traders’ positions in ETH derivatives plays a vital role in assessing the potential for Ether’s price to surpass the $1,970 resistance level.
It is important to note that there may be occasional methodological discrepancies between different exchanges, highlighting the need for readers to focus on monitoring changes rather than relying solely on absolute figures.

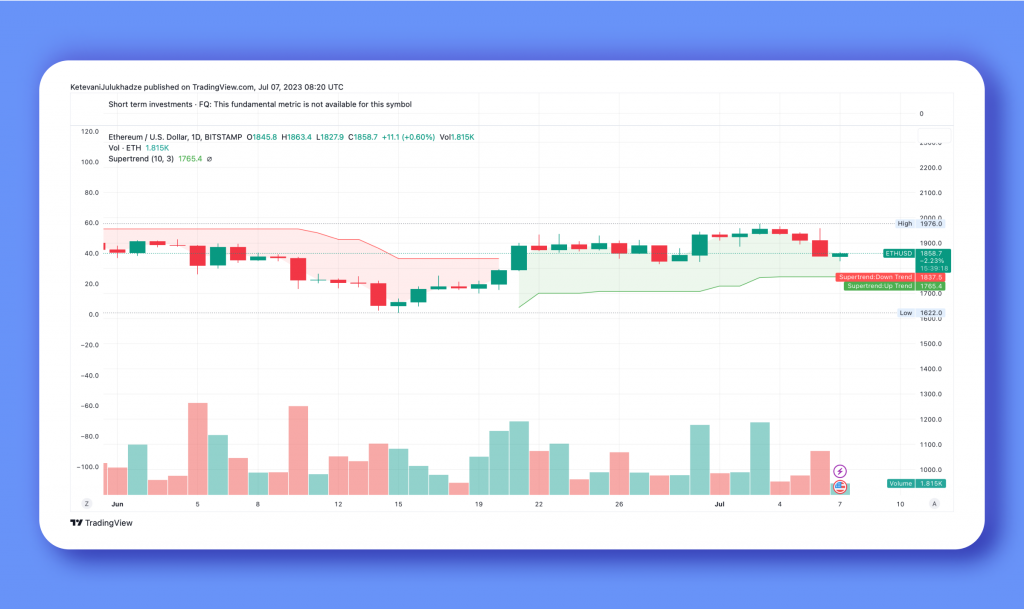
According to the Supertrend indicator, professional traders are inclined to increase their leveraged long futures positions despite Ether trading within a relatively narrow range of $1,765 to $1,837 since June 1. The upward trend in the long-to-short ratio evidences this.
At Binance, the long-to-short ratio experienced a significant rise from 1.14 on June 20 to 1.30 on July 4. Similarly, at OKX, the long-to-short ratio surged from 0.76 on June 20 to a peak of 2.25 on July 4, indicating a preference for leveraged long positions.
Please note that the Supertrend indicator and the observed long-to-short ratios provide valuable insights into professional traders’ sentiment and positioning in the ETH derivatives market.
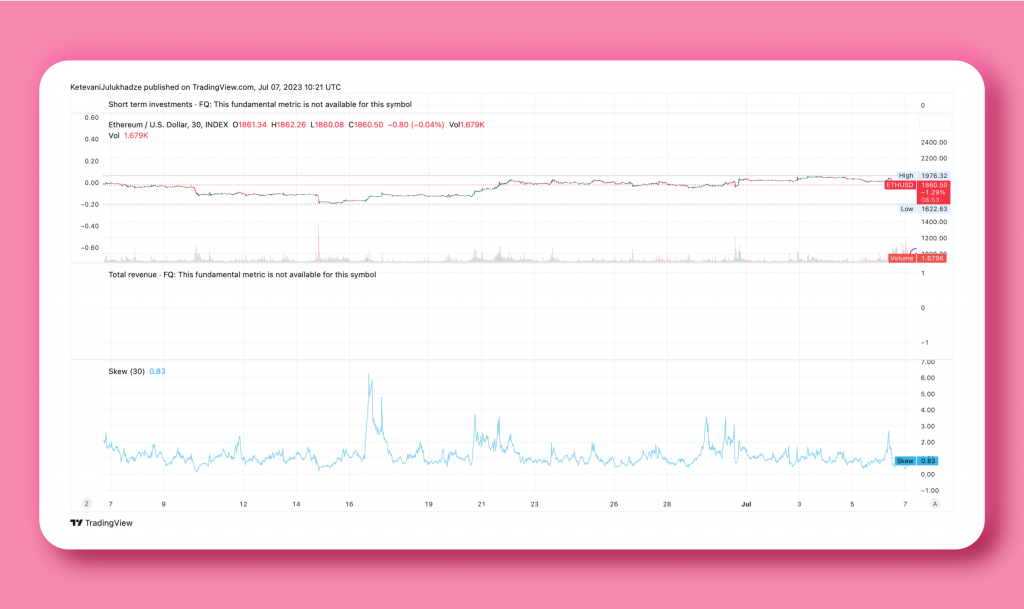
To assess Ether futures independently from external factors, examining the ETH options markets is essential. Analyzing the 25% delta skew indicator, which compares similar call (buy) and put (sell) options, helps determine prevailing sentiment. When fear dominates the market, the skew indicator turns positive, indicating a higher premium for protective put options than call options.

If the skew indicator surpasses 8%, it suggests traders are concerned about a potential crash in Ether’s price. Conversely, a negative 8% skew indicates a sense of overall excitement in the market.
In the recent past, the delta skew showed signs of moderate optimism but could not maintain such levels. The negative 0.83% skew reflects a balanced demand for call-and-put options.
By analyzing the ETH options markets, one can gain valuable insights into market sentiment and gauge the balance between bullish and bearish expectations for Ether’s price.
ETH at $1,700 may be distant, but so is $2,000: Analyzing Factors Affecting Ether’s Price Movement
Considering four key factors – increased leverage long-to-short ratio, declining TVL, potential interest rate increases, and tighter cryptocurrency regulation – the prospects for ETH bears to restrain positive price impact from the Bitcoin ETF saga are strengthened.
While these factors may not be sufficient to drive ETH’s price down to $1,700, they pose significant obstacles for ETH bulls. Notably, the previous attempt to break the $2,000 level on April 13 was short-lived, lasting less than a week. Therefore, in the short term, bears are better positioned to successfully defend the $1,970 resistance level.


