Ethereum Price Update: Decisive Breakout Towards $2,055 Awaits
As staked Ether has risen 18% since Shapella, the Ethereum price has formed a bullish rectangle pattern, the breakout of which could propel ETH to $2,055.
Ethereum price experienced slight downward movement on Tuesday as traders weighed their options following a three-week-long consolidation period. Despite the overall sluggishness in the cryptocurrency market, ETH shows a marginal 0.14% increase, reaching $1,883 with a trading volume of $41 billion.
In contrast, Bitcoin is seeing a 1.1% rise, reaching $30,500. Investors eagerly await the release of the US CPI data, as analysts believe it has the potential to shape the market for the upcoming weeks.
Ethereum Price Eyes Breakout from Consolidation with Rectangle Pattern
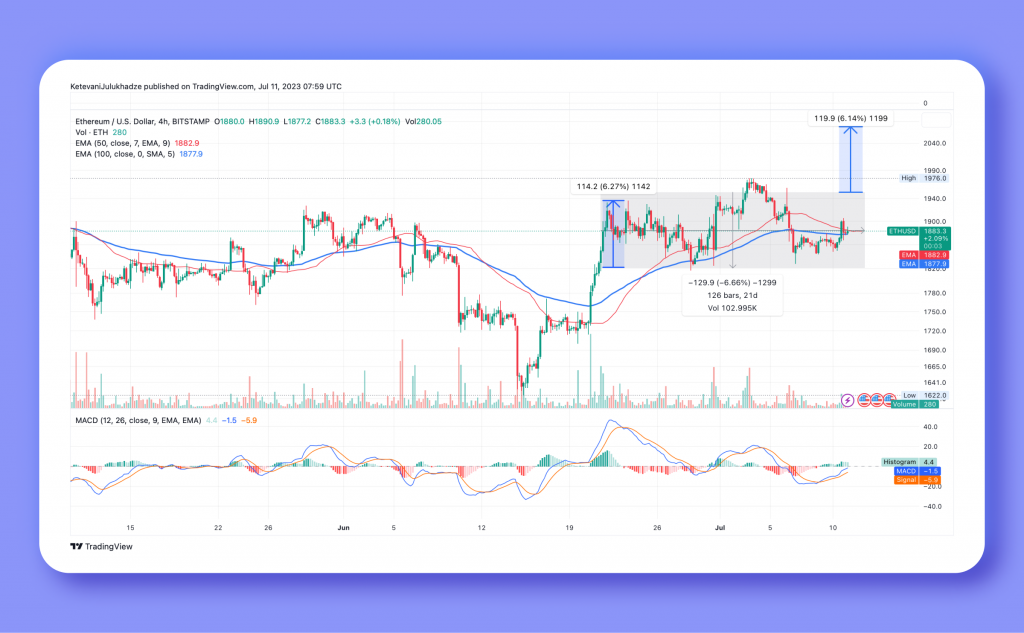
Since June 20, Ethereum has remained within the boundaries of a rectangle pattern, with the potential for a breakout towards $2,055. The bullish rectangle pattern on the four-hour chart indicates a temporary pause in the upward trend before Ethereum’s price resumes its ascent. This pattern forms when the price of ETH moves sideways between two parallel horizontal lines, creating a rectangular shape.
Traders closely observe the confirmation of this pattern, which occurs when the price breaks above the upper resistance line. This breakout signifies that buyers have regained control, indicating a likely continuation of the uptrend. Traders can use the bullish rectangle pattern to identify potential entry points for long positions or exit points for short ones.
Incorporating indicators such as volume, moving averages, or oscillators is advisable to further validate the pattern and assess the strength of the anticipated Ethereum price breakout. These indicators can provide additional insights into market dynamics.
The breakout target is determined by extrapolating the rectangle’s width above the resistance level, which extends from $1,938 to $2,055.

The Moving Average Convergence Divergence (MACD) indicator indicates a bullish sentiment, suggesting that the bulls currently have the advantage. If investors interpret the buy signals for Ether seriously and take action accordingly, it is likely to generate momentum. This increasing momentum further enhances the probability of a breakout from the rectangle pattern.

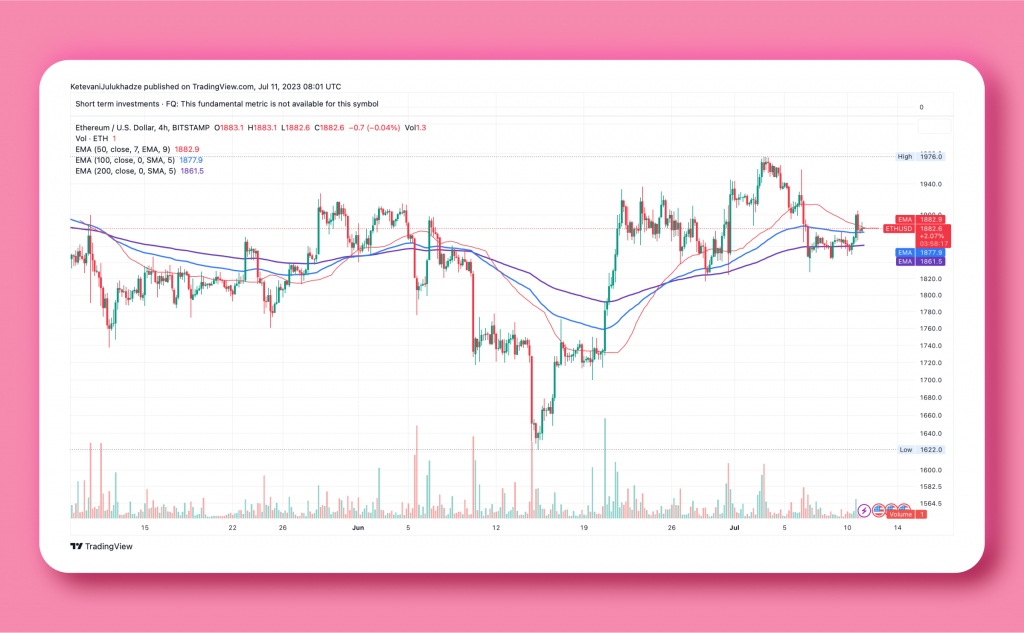
Currently, the bulls are facing a crucial challenge of maintaining support at the 100-day Exponential Moving Average (EMA), represented by the blue line, which is at $1,877. This support level is essential as it allows the Bulls to consolidate their efforts.
Furthermore, they must address the immediate resistance posed by the 50-day EMA, depicted in red at $1,882. By successfully navigating these obstacles, the bulls can strengthen their position and potentially pave the way for upward movement.

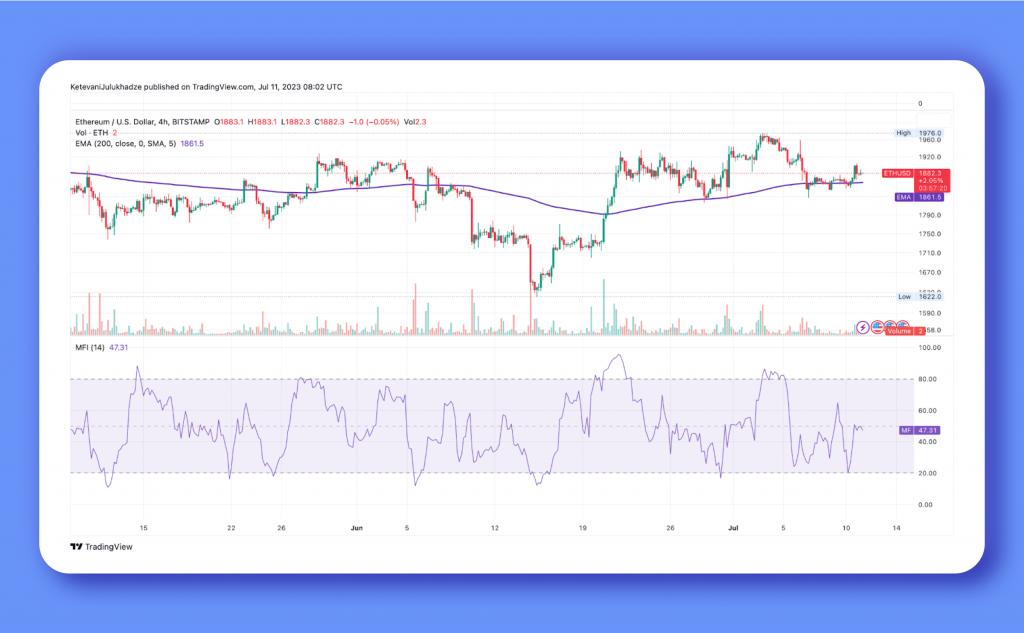
For the uptrend to resume, the support areas provided by the 100-day Exponential Moving Average (EMA) and the 200-day EMA (depicted in purple) are critical. Notably, the Money Flow Index (MFI) shows a downward trend from the midline (47).
If the price experiences a decline that goes beyond the 200-day EMA, located at $1,861, market attention will shift towards the next significant level of buyer congestion at $1,800. However, there is a chance that the support at $1,830 will be able to absorb the selling pressure. On the other hand, if the price breaks below the support provided by the rectangle pattern, it could lead to further declines, potentially targeting the $1,700 level.
Impressive 18% Rise in Ethereum Staking Since Shapella Upgrade
Following the implementation of the Shapella upgrade, the option to withdraw staked Ether on the Beacon chain has been made available to investors. This marks a significant development since Ethereum transitioned to a proof-of-stake (PoS) consensus mechanism.
Initially, analysts raised concerns about the potential strain on Ethereum’s price due to the increased availability of previously locked ETH. However, contrary to expectations, the staking activity has surged by 18% since the upgrade, as indicated by on-chain data from Glassnode.
As more Ether is staked, the circulating supply of the platform is shrinking. The newfound ability to stake and unstake Ether at will has instilled confidence in investors, particularly among those seeking to grow their holdings during the waiting period of the bull market.
Staked Ether accounts for nearly 21% of Ethereum’s circulating supply. If this trend persists, the selling pressure is likely to diminish significantly, creating a favorable environment for a potential rally.
As the staking activity continues to grow and contribute to the stability of the Ethereum ecosystem, investors may consider exploring staking opportunities to participate in this evolving landscape.


