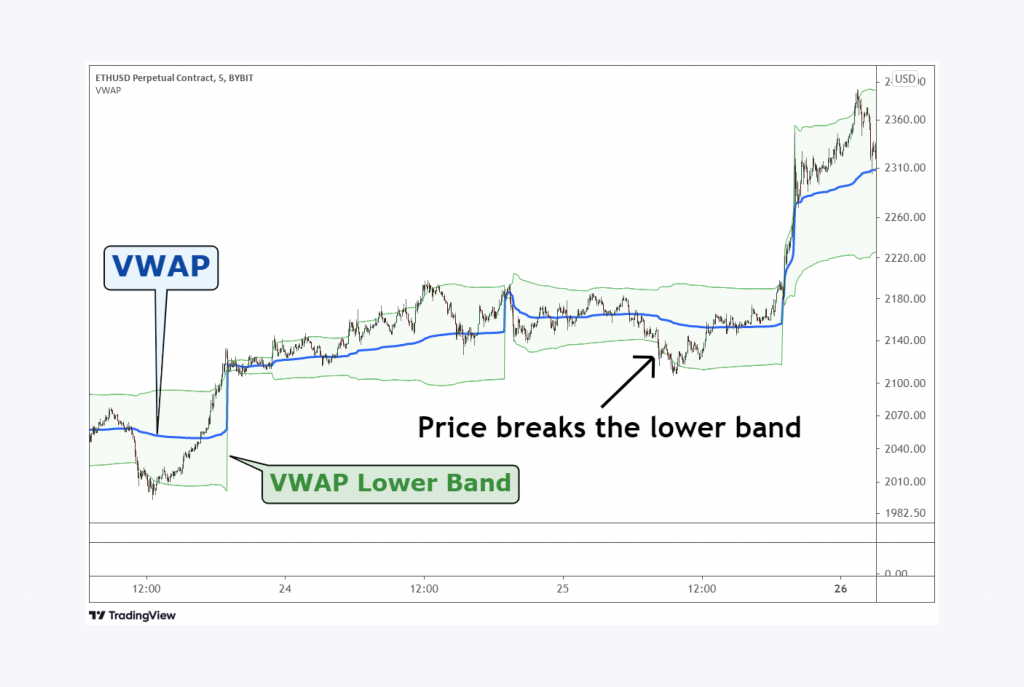
What Is VWAP in Crypto Trading?
Imagine buying groceries without knowing whether the day’s prices are high or low. That’s similar to trading cryptocurrency without the right tools to gauge market value. One powerful technical analysis tool that has become popular among both casual day traders and Wall Street veterans is the Volume Weighted Average Price (VWAP).
Think of it as a smart price tracker that doesn’t just tell you what crypto is selling for right now but what people are actually paying for it throughout the day, weighted by how much they’re buying.
In this guide, we’ll explain how VWAP works, reveal why it’s become an essential tool in crypto trading, and show you practical ways to spot better trading opportunities. Whether you’re just starting or looking to sharpen your trading strategy, understanding VWAP could be the key to making more informed decisions in the volatile crypto market.
Key Takeaways
- VWAP combines price and volume data to provide a dynamic trading indicator that helps crypto traders identify true market value and potential entry/exit points throughout the trading session.
- VWAP indicator is a reliable benchmark for determining overbought and oversold conditions, with prices above VWAP suggesting potential selling opportunities and below indicating possible buying zones.
- Successful VWAP trading requires combining the indicator with other technical analysis tools and implementing proper risk management strategies.
What Is the VWAP Indicator?

VWAP, or Volume Weighted Average Price, is a technical indicator that calculates the average price of a cryptocurrency weighted by its total volume traded over a specific period. Unlike simple moving averages, VWAP gives more importance to closing price levels where higher trading volume occurs, making it a more accurate representation of market value.
The VWAP line is calculated using a specific formula that factors in the typical price and the total trading volume within an intraday trading session. This makes the volume-weighted average price a reliable benchmark for evaluating trade execution quality, identifying support and resistance levels, and assessing market trends.
Fast Fact:
Peter Steidlmayer, a pioneer in market analysis and founder of the Market Profile theory, invented the VWAP indicator. Steidlmayer designed it to measure institutional activity and identify potential support and resistance levels.
How Is the VWAP Indicator Calculated?

The weighted average price (VWAP) calculation involves three main steps:
1. Calculate the typical price (The average of the high, low, and close prices): Typical Price = (High + Low + Close) / 3
2. Multiply the typical price by volume: Typical Price × Volume
3. Calculate the cumulative totals: Cumulative (Price × Volume) / Cumulative Volume
VWAP Formula: (Σ (Price × Volume)) / (Σ Volume)
The weighted average price (VWAP) calculation resets at the start of each trading session, providing a fresh perspective on intraday price movements.
VWAP Meaning in Crypto Trading
In crypto trading, VWAP serves as a critical benchmark to gauge whether an asset is trading above or below its fair value.
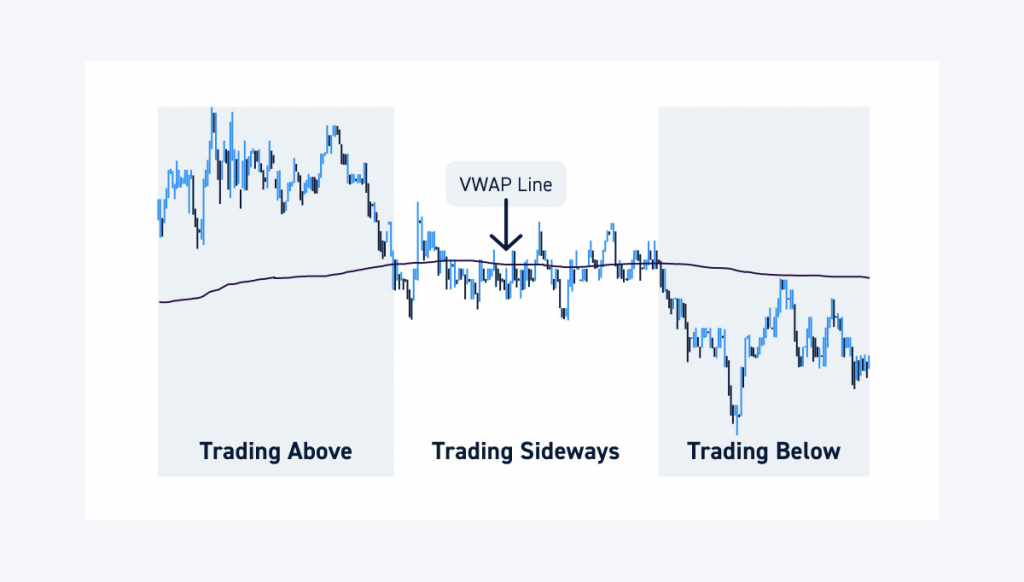
- Above VWAP Line: Indicates bullish momentum and potential overbought conditions.
- Below VWAP Line: Suggests bearish sentiment and possible oversold conditions.
Consider a scenario where Bitcoin is trading at $30,000. A trader notices the VWAP line at $29,800. If the price is trending upward and staying above the VWAP, the trader might consider entering a long position, anticipating further bullish momentum. Conversely, if the current price falls below the weighted average price (VWAP), it may signal a shorting opportunity.
VWAP offers valuable insights for crypto traders by:
Identifying Potential Entry and Exit Points: The VWAP line on a price chart acts as a dynamic reference point. If the price moves above the VWAP, it suggests potential buying pressure and vice versa. Traders can use this information to identify entry and exit points for their trades.
Assessing Market Trends: By analyzing the VWAP line’s direction, traders can gauge the overall market trend. A rising VWAP indicates an uptrend, while a falling VWAP signifies a downtrend.
Gauging Market Sentiment: High trading volume around the VWAP line suggests strong market conviction at that price level. Deviations from the VWAP can indicate potential overbought or oversold conditions.
This insight allows intraday traders, swing traders, and institutional investors to determine entry and exit points while minimizing the market impact of their trades.
How to Use VWAP

VWAP is a versatile tool that can be applied in various trading scenarios. Savvy crypto traders can incorporate VWAP into their strategies in several ways:
VWAP as Support and Resistance
The VWAP line can act as a dynamic support or resistance level. Price movement bouncing off the VWAP might indicate potential reversals, while sustained breaks above or below can signal price trend continuation.
Combining VWAP with Other Indicators
Using VWAP alongside other technical indicators like the RSI (Relative Strength Index) can provide a more comprehensive picture of market dynamics. This combination helps traders confirm potential trading signals and refine their strategies.
Advanced traders can explore more complex VWAP applications:
- Time-Weighted Average Price (TWAP): This is similar to VWAP but assigns equal weight to each data point within the chosen timeframe, offering a different perspective on average price action.
- Average price-weighted Calculation for Different Timeframes: Extending VWAP calculations beyond a single trading session can provide insights into longer-term market trends for swing traders.
- Combining VWAP with Risk Management Strategies: Integrating VWAP with stop-loss orders and other risk management strategies helps traders manage potential losses.
Understanding and utilizing weighted prices can significantly enhance your trading strategy, whether you’re a day trader, swing trader, or institutional investor.
Day traders can leverage VWAP to:
- Identify Intraday Trends: By monitoring the VWAP line’s direction, day traders can quickly identify short-term trends and adjust their positions accordingly.
- Time Entries and Exits: VWAP can help day traders time their entries and exits more precisely. For example, buying near the VWAP during a dip or selling near the VWAP during a rally can improve profit potential.
- Manage Risk: VWAP can be used as a dynamic stop-loss level, helping traders protect their profits and limit potential losses.
Swing traders can use VWAP to:
- Identify Potential Reversals: When the price breaks below the VWAP, it may signal a potential downward reversal. Conversely, a break above the VWAP can indicate an upward reversal.
- Confirm Trend Strength: A sustained movement above or below the VWAP can confirm the strength of an existing trend.
- Set Profit Targets: Swing traders can use the VWAP as a reference point to set realistic profit targets.
Institutional traders can utilize VWAP to:
- Optimise Trade Execution: Institutional traders can minimize market impact and reduce transaction costs by breaking down large orders into smaller pieces and executing them strategically around the VWAP.
- Measure Trading Performance: VWAP can be used as a benchmark to evaluate the performance of trading strategies and algorithms.
Here are common VWAP trading mistakes to avoid:
1. Overreliance on a single timeframe
2. Ignoring market conditions
3. Not considering volume patterns
4. Trading against strong trends
5. Neglecting risk management
Advantages & Limitations
VWAP improves trade execution quality. By considering volume alongside price, traders can execute trades closer to the true market value, minimizing slippage and maximizing profits.
VWAP provides valuable insights into market activity and sentiment, enabling traders to make more informed decisions about entering and exiting positions.
It can help traders identify potential breakouts from support and resistance levels or reversals in trend direction, leading to lucrative trading opportunities.

However, despite its benefits, the VWAP strategy has limitations. Like most technical indicators, volume-weighted average price is a lagging indicator that reacts to past price movements. It doesn’t predict future price movements but can highlight potential trends. Furthermore, large orders institutional investors place can significantly impact the VWAP calculation, potentially misleading individual traders.

Conclusion
VWAP works best as part of a larger trading strategy. Just as you wouldn’t sail across the ocean with only a compass, you shouldn’t trade solely based on VWAP signals. Combine it with other technical indicators, fundamental analysis, and, most importantly, solid risk management practices. The most successful traders use VWAP as one piece of their decision-making puzzle, not the entire picture.
Remember, the goal isn’t just to make profitable trades – it’s to become a more disciplined and systematic trader. VWAP can help you get there, but only if you use it wisely as part of your more extensive trading toolkit.
FAQs
How accurate is VWAP?
Think of VWAP like looking in the rearview mirror while driving – it shows you what’s already happened, which means it lags behind real-time price movements. While it’s still a solid tool, you probably don’t want to rely on it alone. Most experienced traders use it alongside other indicators to get a fuller picture.
What is VWAP in trading?
Volume-weighted average price (VWAP) is a ratio of the cumulative share price to the cumulative volume traded over a given time period.
What does the VWAP tell you?
VWAP is the average price of a stock weighted by volume. By monitoring VWAP, a trader might get an idea of a stock’s liquidity, and the price at which buyers and sellers agree is fair at a specific time. Day traders can use the VWAP indicator to monitor intraday price movement.
Is VWAP better than EMA?
Both tools are useful but for different jobs. VWAP is like a GPS for day trading – great for navigating the market during a single day because it determines how much trading is happening. EMA is more like a compass, which helps see where prices are headed over longer periods.
What is the best timeframe for using VWAP?
VWAP really shines during active trading hours, especially on shorter timeframes like 1, 5, or 15-minute charts. It’s most helpful if you plan to get in and out of trades within the same day – like a daily reset button that helps you stay oriented in short-term price movements.


