
Understanding the Hidden Bullish & Bearish Divergence in Trading
The online trading scene has evolved past early and simplistic days of monitoring price movements and analysing fundamental trends. Today, most of the average traders have access to advanced trend indicators, algorithms and formulas that were only possessed by industry experts in the past.
It has never been easier to retrieve in-depth knowledge in the trading field and use readily available resources in your daily trading operations. However, it is crucial to understand each complex trend indicator and strategy well to apply them properly.
This article will discuss one of such invaluable yet challenging trend indicators that identify hidden bullish & bearish divergence across the trading markets.
Key Takeaways:
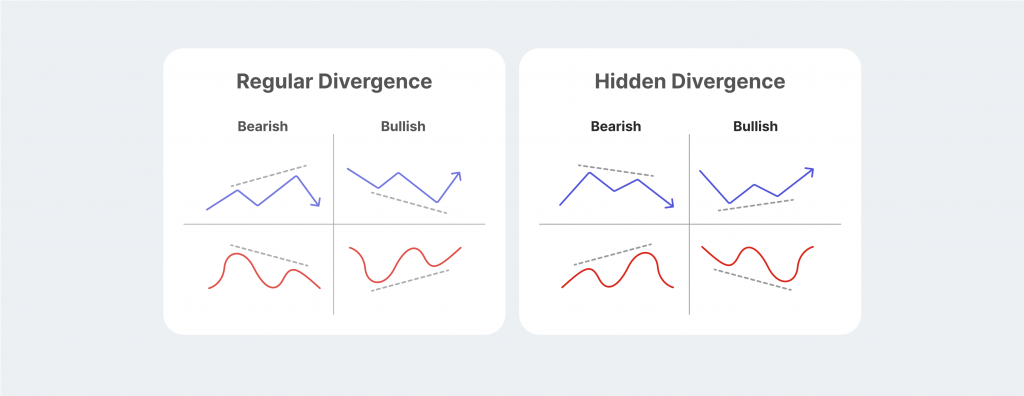
- The regular divergence patterns showcase when the price trend reversal is likely.
- Divergence analysis is conducted by comparing the price charts with RSI, MACD or other trend indicators.
- Hidden divergence showcases when the trend continuation is likely due to weakened or strengthened price action.
- While the divergence analytics are powerful, it is advisable to use them in combination with other trend analysis mechanisms.
Exploring the Divergence Pattern Concept
Divergence is a straightforward concept in trading, signalling a trend reversal for an asset price in the immediate future. Divergence implies that a given tradable asset is trending in a specific direction, but its corresponding trend indicator goes in the opposite direction. When such a difference is identified, traders believe the market sentiment is about to shift.
To further visualise the divergence concept, suppose we have a currency X trending downwards. While looking at the simple price chart, an unsuspecting investor would assume that the trend continuation is inevitable and that currency X will suffer additional losses.
However, a momentum indicator could paint a different picture, showcasing improving numbers despite the price dip. In this case, the trend indicators showcase the strength of a given trend and the points where the price trend might be weakened enough to reverse.
As a result, divergence patterns allow traders to anticipate the points of trend reversals, permitting them to plan for the expected price changes and take long or short positions depending on the divergence results. The market pattern described above is referred to as a regular divergence.
Regular VS Hidden Divergence
In many cases, the tradable asset prices might experience a hidden divergence. While both regular and hidden divergence trends share the same principle, the hidden variation is much harder to spot and analyse. Both variations have their merits. Regular divergence is considerably easier to spot and doesn’t take a lot of practical trading experience.
However, this pattern is so obvious to most market investors that identifying it doesn’t guarantee any advantages. After all, if everyone is aware of the potential price reversal, it will be hard to acquire winning positions before the market is saturated.
On the other hand, hidden divergence is much more complex to identify but unreliable in some instances. Since the pattern is understandably less aggressive, hidden divergence might sometimes be a coincidence that doesn’t actually lead to any price reversal trends.
A Quick Refresher on RSI and MACD Indicators
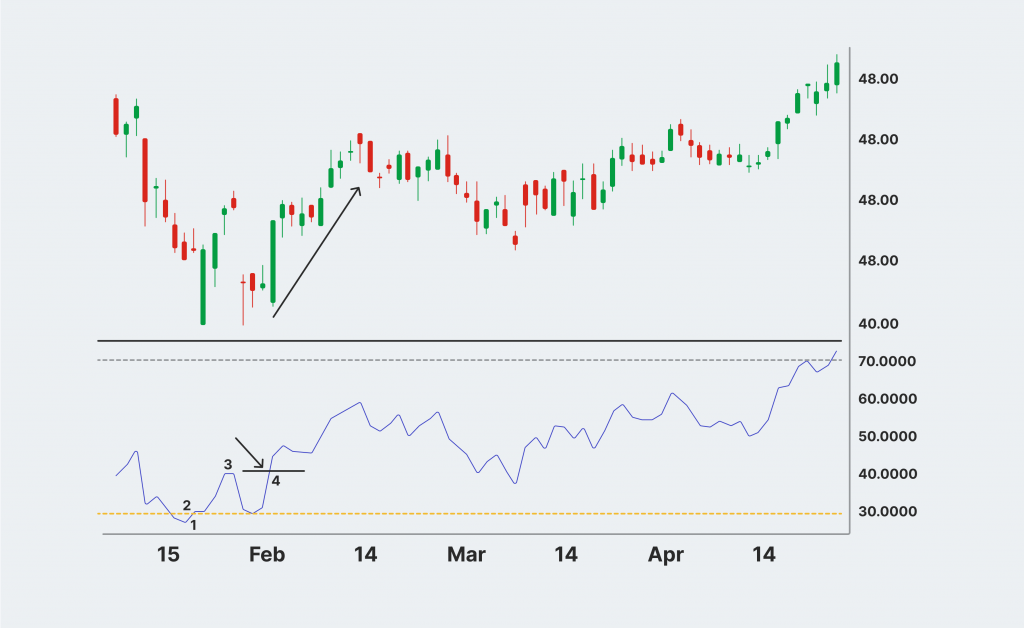
As outlined above, divergence patterns must be identified by analysing price charts with various trend indicators. The most popular options for this analysis are the relative strength index (RSI) and the moving average convergence/divergence (MACD) indicators. These indicators are equally effective in identifying both bullish and bearish divergence patterns.
The RSI indicator showcases the strength of the asset’s price movements against its historical data, allowing traders to identify whether previous trends support the price movement. The RSI indicator helps traders identify whether the asset is overpriced or undervalued at any given moment in relation to its own price movements.
Thanks to its reliability, the RSI indicator has gained global popularity as one of the most influential trend indicators.
The MACD indicator also identifies whether the tradable asset is overbought or oversold. However, unlike the RSI indicator, the MACD is calculated using the exponential moving averages.
As a result, MACD is more oriented on gauging the relative momentum of the market instead of analysing the direct price movements. MACD and RSI are frequently used in tandem to obtain a more accurate picture of market trends.
Fast Fact:
Most advanced trend indicator formulas like RSI and MACD are readily available on exchange or brokerage platforms, allowing newcomer traders to analyse them without complex calculations.
What is a Bullish Divergence?
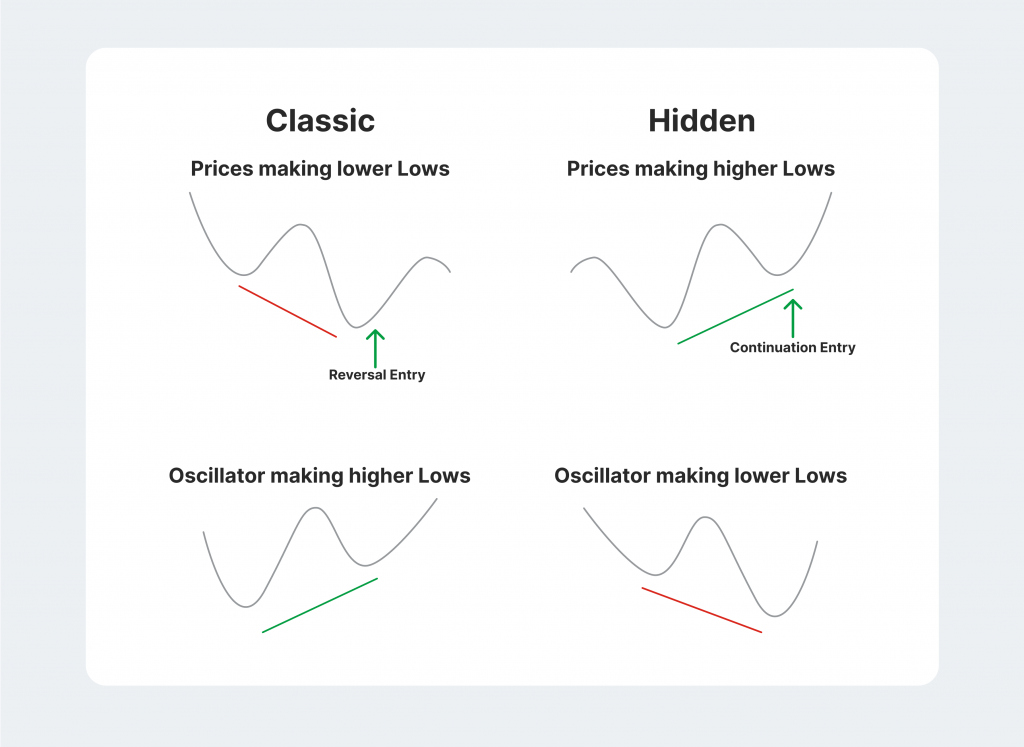
The bullish divergence is the first of two significant subtypes of divergence patterns. Suppose the currency X is firmly trending downwards on the open market, showcasing consistent lower lows. The basic price chart clearly showcases that the asset should continue to devalue in the foreseeable future.
However, if the traders analyse a trend indicator like RSI, they might identify an opposite pattern. If the RSI indicator consistently shows higher lows on its chart, we are dealing with a bullish divergence RSI pattern.
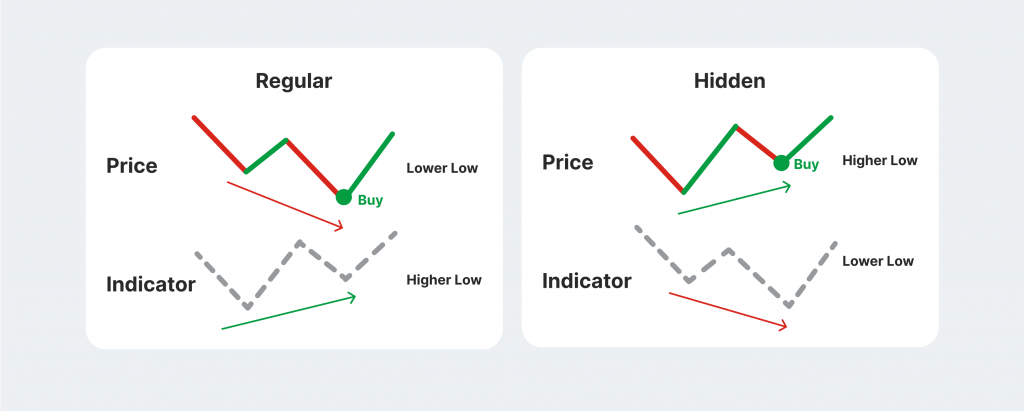
The hidden bullish divergence RSI is similar to its regular counterpart but has one significant distinction. Instead of signalling the trend reversal, the hidden bullish divergence predicts trend continuation.
Suppose the currency X from the example above is trending high, and investors want to know if the price pattern will continue and if it is safe to take a long position.
If the price chart shows higher lows and the RSI indicator simultaneously marks lower lows on the chart, then currency X is going through a hidden bullish divergence, and the price trend will most likely continue.
What is Bearish Divergence?
Bearish divergences are pretty similar to their bullish counterparts but provide signals that the market prices will either continue the dip or reverse into a bearish position. The regular bearish divergence occurs when the price charts indicate higher highs in the market, but the respective oscillator shows signs of weakness and produces lower highs.
As a result, investors can analyse that despite the price uptrend, the overall market activity is weakening, and a price reversal will be expected shortly.
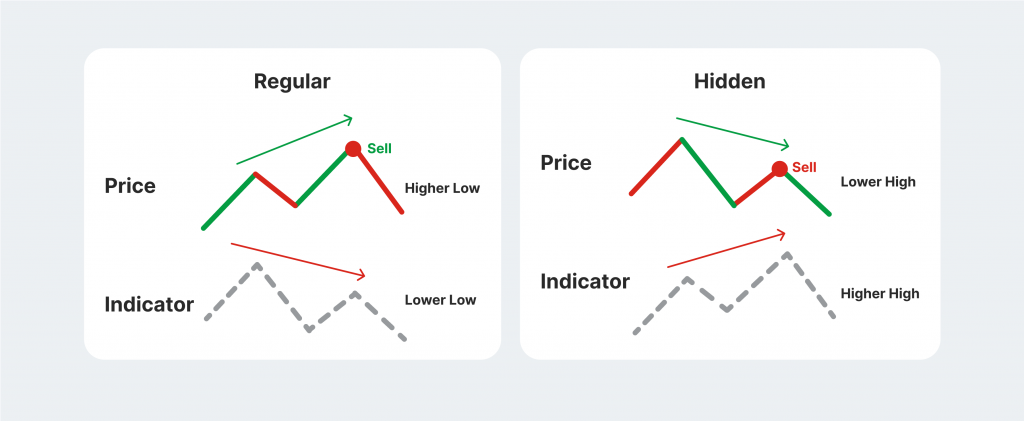
The hidden bearish divergence happens if the price downtrend is ongoing, but the trend indicator consistently showcases higher highs. This means that the market action supports the current price dip and will not reverse immediately.
Just like its bullish counterpart, the bearish divergence RSI negatively correlates with the respective price chart, showcasing that the price action does not support the asset uptrend.
Conducting the MACD bearish divergence analysis can be just as effective as RSI, showcasing the relationship between the asset’s current and historical momentum. However, using both indicators to strengthen or challenge your price reversal predictions is advisable.
Applying Hidden Bullish and Bearish Divergence in Trading Strategies
As outlined above, regular and hidden divergence patterns are critical in trading, allowing traders to form specific predictions within a given trading period. However, the divergence indicators can be tricky to use, and traders should always be mindful of potential errors.
Identify Hidden Market Patterns
The most significant advantage of applying regular and hidden divergence RSI is in identifying market sentiment and the strengths of the price action. Investors can earn a considerable amount of profits by expecting a specific price reversal or continuation and being able to place long or short positions without increasing market exposure risks.
But which divergence variation is better for your purposes? The bullish vs bearish divergence strategies have long been debated, with mixed opinions on which approach is more profitable. However, it all comes down to personal preference and the nature of your strategies. If you wish to pursue more aggressive trading tactics, searching for a bullish divergence showing signs of a price downtrend reversal is more profitable. On the contrary, banking on the bearish divergence is safer in most markets, as the price uptrend reversal or downtrend continuation is more likely to occur.
Place Appropriate Stop-Loss Orders
Aside from forming short or long positions for a specific asset, divergence patterns can also predict the extent of price reversals or trend continuation. So, it is much easier to place stop-loss or take-profit orders within the specified intraday trading period. As a result, traders can exit their positions when it is most profitable for their bottom lines.
However, the entire divergence concept must be treated with caution. As analysed above, this pattern recognition strategy can be faulty and might showcase skewed results.
The risk is further increased with bullish or bearish hidden divergence since the trends are less outlined in this case and have a higher chance of showing misleading results.
So, while divergence recognition is a dominant and popular strategy, it is best to employ other analytics methods to double-check your market expectations.
Final Thoughts
The regular and hidden divergence patterns are beneficial mechanisms both for newcomer and experienced traders. Their bearish and bullish variations can signal significant market reversals or continuing trends, giving investors a tight grip on the market sentiment.
However, there can be numerous cases where the divergence indicator shows inconsistent or misleading results, leading traders to believe that a reversal is imminent when, in fact, the analysis is wrong.
So, it is essential to remember that a single analytics tool can’t reliably and precisely predict the potential trend movements in chaotic trading markets. So, using the divergence strategy is highly encouraged with other powerful trend identification tools.


