Bitcoin ETF Inflows Driving BTC Price Rally
The crypto market has been experiencing rollercoasters of highs and lows. The recent addition of crypto ETFs has added a new factor affecting the prices of coins.
The recent BTC price rally could have restored faith in the leading cryptocurrency after a bull run carried the coin’s price to $68,000 for the first time in over a month, more significantly, after sinking under $55,000 at the beginning of July.
The BTC ETF news, the Ethereum ETF approval, and Bitcoin futures contracts are all factors that contributed to this temporary price jump.
BTC ETF News
The beginning of July saw Bitcoin’s worst performance since February-March of this year. The coin kept deteriorating from the beginning of June at $70,000 to the beginning of July, when its intraday transaction value reached $53,000 on July 5th.
However, the positive BTC ETF inflows and the bulls’ outperformance pumped the coin price between July 12th and 21st, as Bitcoin reached $68,000 before dropping again to $63,000.
Despite the setback to 63k, traders are optimistic about future prices after pushing the support level above the $60,000 mark.
At the same time, according to The Block reports, Bitcoin ETFs saw net positive flows that crossed over $300 million for the first time this month, which contented moving upwards until July 22nd, reaching $485 million.
This trend benefited short-term holders’ realised price, who netted $64,000 on their liquidated positions.
Factors Driving The BTC ETF Flows
The BTC ETF value increased by 4.2% over the last week despite a massive drop on July 23rd. Many factors contributed to this uptrend movement after almost a month of losing value.
The latter price drop recorded the end of the positive rally, attributed to stock performance and crypto ETFs.
The NASDAQ index and tech stocks recorded significant losses on July 24th earnings reports, causing many investors to halt their investments, including the crypto market and Bitcoin ETFs.
Moreover, the approval of Ethereum spot ETFs indirectly affected the Bitcoin ETF price. The market saw investors liquidating their BTC assets to seek better financial performance from the new ETFs, which surpassed $1 billion in trading volume a few days after their launch.
Bitcoin Price Performance
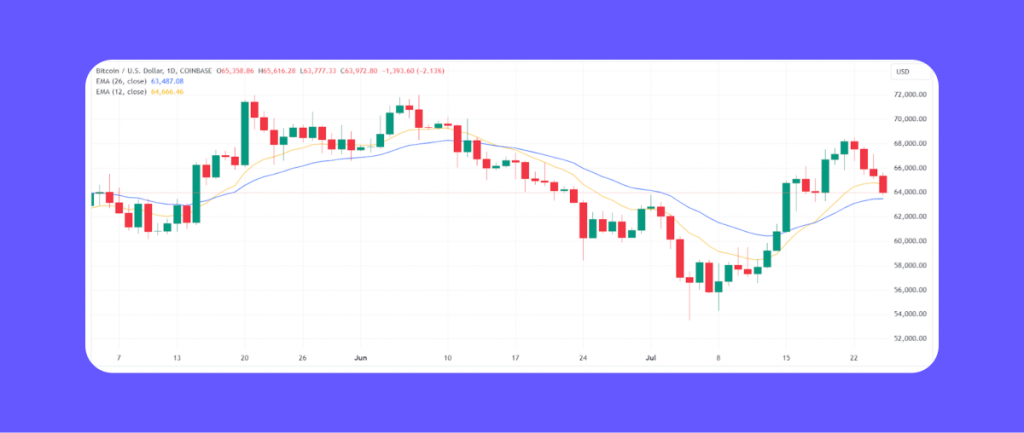
Let’s analyse the Bitcoin price performance and draw predictions using the exponential moving average indicator. We start with two short-term timelines, 12-day and 26-day EMAs.
Here, we see the short-term line (in gold) moving above the long-term line (in blue). This indicates a bullish movement. However, the 12-day line’s growth slowed down on July 23rd and started moving downwards, suggesting a possible setback.

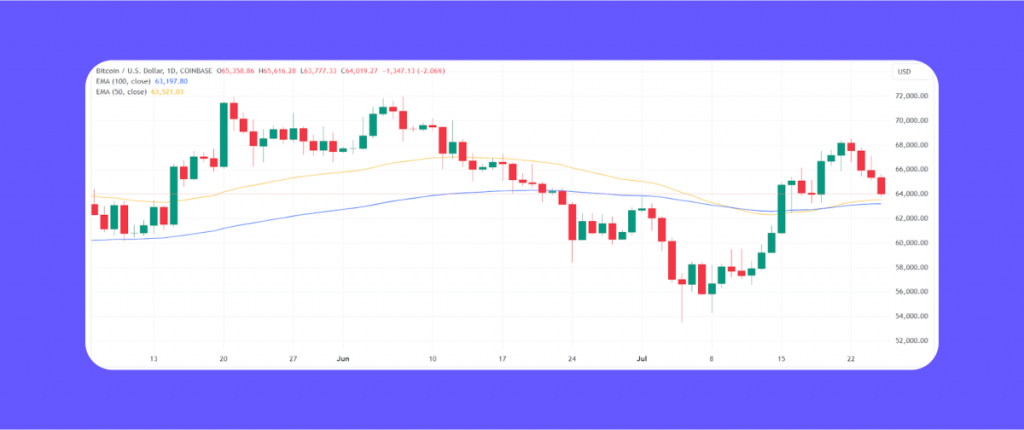
The same applies if we take a look at long-term projections. Both lines move under the market price. However, the 50-day line is just slightly off the 100-day line and does not indicate a strong upward trend.
This could mean that the current market price will prevail for a while before another event takes the price up or down.

Conclusion
The ETH and BTC ETF news, stock performances, and investors’ confidence have driven the crypto market up and down. The recent Bitcoin price rally put the coin one journey away from the $70,000 level.
More significantly, the changing BTC ETF inflows and staggering ETH ETF trading volume can bring the market to the surface again. Will Bitcoin break its price record before the end of this year?
Disclaimer: This article is for informational purposes only and should not be construed as financial advice. Investing in cryptocurrencies, including meme coins, carries ingrained risks, and individuals should conduct their own research before making any investment decisions.


