
Bitcoin, Ethereum, Ripple Price Predictions: BTC Maintains Control over Altcoin Bears
Recent developments in the cryptocurrency market have seen notable movements in Bitcoin (BTC), Ethereum (ETH), and Ripple (XRP) prices. While BTC faces a critical resistance level, ETH shows potential for a breakout, and XRP remains range-bound.
- Bitcoin (BTC): After a 26% surge, BTC price attempts to overcome the hurdle at $30,711 but struggles due to strong resistance.
- Ethereum (ETH): ETH price appears poised for a breakout, potentially triggering a minimum rally of 21% towards $2,439.
- Ripple (XRP): XRP price continues to bounce between the barriers at $0.548 and $0.413, eagerly anticipating a breakout.
These developments indicate both challenges and opportunities for traders and investors in the cryptocurrency market, highlighting the need for careful monitoring and analysis of price movements in these digital assets.
Bitcoin Price Reaches A Crucial Turning Point.
Bitcoin (BTC) has experienced a significant rally of 26% since June 15, surpassing the previous local top at $31,214 and establishing a slightly higher high at $31,430. The technical indicators indicate a bullish momentum, with the Relative Strength Index (RSI) crossing above the 50 mean lines and the Awesome Oscillator (AO) showing a green histogram bar above the zero line.
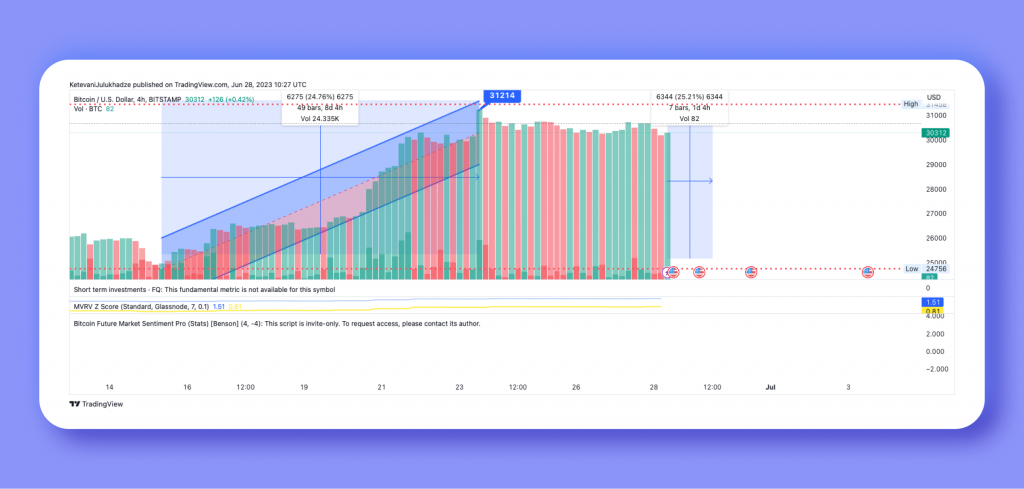
A crucial development to watch for is the decisive break of the three-day Trend Resistance level at $30,711, which would serve as a buy signal. In such a scenario, Bitcoin’s price could target the weekly Bearish Breaker’s midpoint at $35,260.
While it is less likely, if the bullish momentum persists, there could be a potential retest of the upper limit of the Bearish Breaker at $41,273.
However, it is essential to consider the bearish divergence observed between BTC’s three higher highs since January and the RSI’s three lower highs. This pattern suggests a potential correction in the underlying asset.
Overall, the momentum indicators support the bullish outlook for Bitcoin price, but investors should closely monitor the RSI divergence and exercise caution.
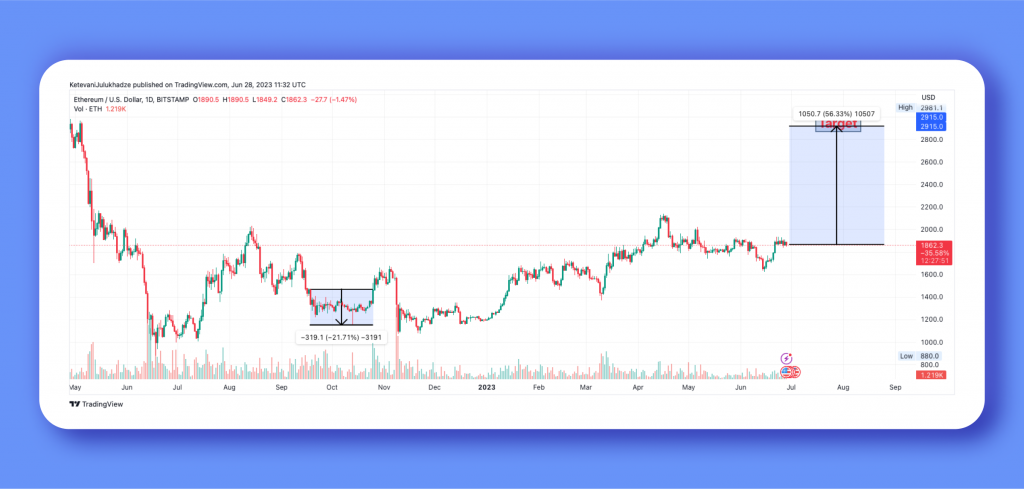
Buying Opportunities Awaited In Ethereum’s Price.
Ethereum (ETH) price exhibits strong promise, supported not only by technical analysis but also by bullish indicators. Between May 31, 2022, and June 28, 2023, ETH has formed an ascending triangle pattern, characterized by approximately three equal highs and four higher lows.
To initiate this significant bullish move, Ethereum price must successfully surpass the mentioned barrier, solidifying the breakout.
Adding credibility to this bullish outlook are the RSI and AO indicators, both surpassing their respective mean lines of 50 and 0. This indicates a shift in momentum favoring the bulls. Additionally, the Wave Trend indicator displays a bullish crossover just above the oversold zone, further supporting the optimistic thesis.
Conversely, if Ethereum price records a definitive three-day close below $1,639, it would invalidate the bullish thesis based on the ascending triangle pattern. In such a scenario, increased selling pressure could lead to a potential decline of approximately 15% towards $1,408.
Investors and traders should closely monitor Ethereum’s price movement and these critical levels to gain further insights into its potential trajectory in the coming days.
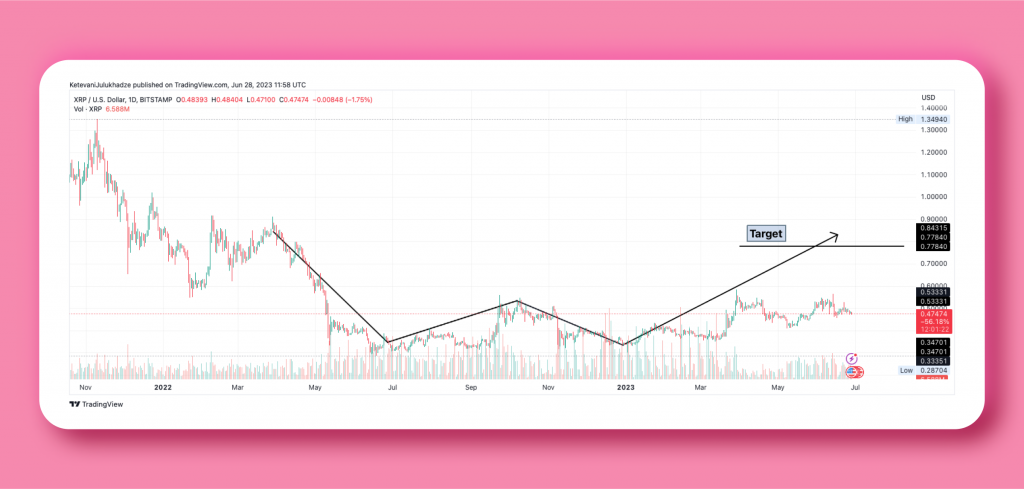
Clarification Of Recent Ripple’s Prices.
Ripple (XRP) price has been trading within a range, bounded by the $0.548 and $0.413 levels, since March 26. A significant breakthrough of the upper limit at $0.548, transforming it into a support floor, would serve as a strong buy signal. In such a scenario, XRP has the potential to initiate a 40% upswing towards $0.778, aligning with the target of a potential double bottom pattern observed on the chart.
However, it is important for investors to consider the indicators. The RSI and AO indicators exhibit clear lower lows, contrasting with the equal highs in XRP price. This formation, known as “exaggerated bearish divergence,” often indicates a substantial correction for the underlying asset.
The Wave Trend indicator also signals a bearish divergence, further supporting the overall bearish outlook. Therefore, if a pullback occurs and breaks below the support level at $0.413, it would invalidate the bullish thesis. Such a move could trigger a correction of approximately 17%, with the next State Trend Support located at $0.334.
Traders and investors should closely monitor the price action of Ripple (XRP) and these critical levels to make informed decisions in light of the potential bullish and bearish scenarios.
Bottom Line:
Recent developments in the cryptocurrency market show mixed trends for Bitcoin (BTC), Ethereum (ETH), and Ripple (XRP) prices. Traders should closely monitor key levels and indicators to navigate the market effectively. Stay informed and analyze price movements , Monitor crucial resistance levels and indicators to make well-timed trading decisions.


