
Bitcoin Price Breaks Through Resistance, Targets $32,000.
The Bitcoin price has remained stagnant over the past six weeks, with no significant movement from buyers or sellers. This lack of direction has caused uncertainty in the crypto market, as indicated by the short-bodied daily candles with long wicks. Let’s delve into the considerations if you’re wondering whether to enter the market amid growing funds or sell your holdings.
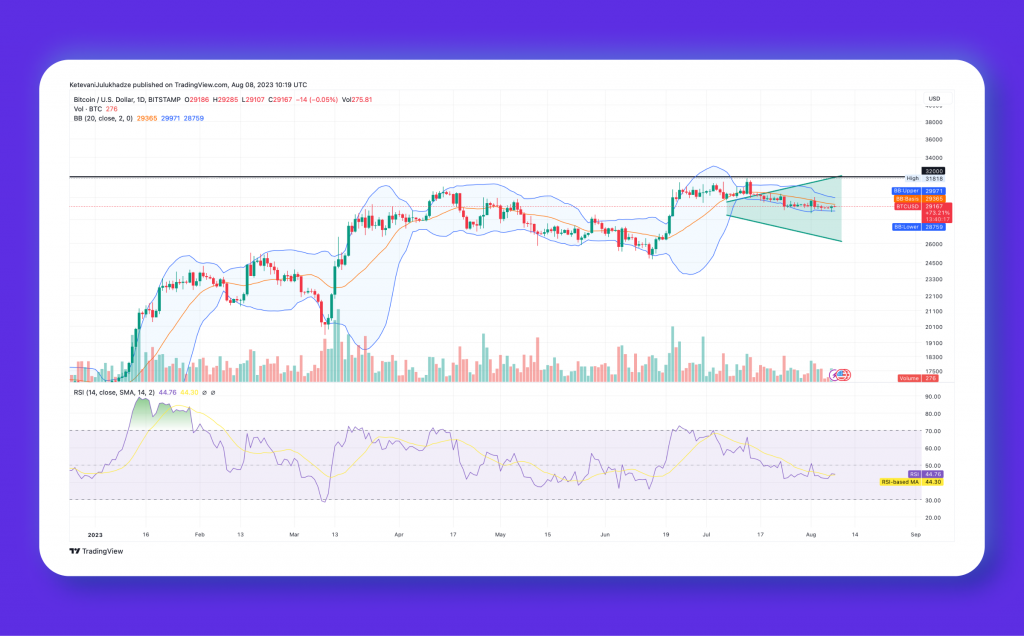
Bitcoin’s Daily Chart Analysis
- The ongoing lateral movement of Bitcoin finds its origins in the intriguing megaphone pattern.
- A robust accumulation zone for prospective buyers could potentially emerge along the bottom support trendline.
- Notably, Bitcoin’s intraday trading volume boasts a remarkable $12.6 billion, signifying an impressive 93% surge.
On the 24th of July, a bearish breakdown shook the foundation of Bitcoin’s price, pushing it below the crucial monthly range of $29820-$29726. This shift in dynamics handed sellers a notable advantage, painting a picture of a potential 4.5% further decline towards the next vital support at the ascending trendline.
The ascending trendline, however, presents a formidable prospect for strong support, having diligently upheld a consistent upward trajectory over the course of the past seven months. Its historical resilience offers hope to traders seeking stabilisation in a turbulent market.
Curiously, the days following the breakdown have seen Bitcoin’s price action evolve into a lateral movement on the daily chart. While the initial breakdown hinted at a more pronounced descent, the surprising lack of forceful selling pressure suggests an interesting twist: active buyer intervention to prop up the price. This intriguing consolidation phase reveals a potential chink in the armour of the bearish momentum.
Potential Bear Trap Scenario Unveiled
A noteworthy perspective emerges, suggesting that the earlier breakdown of $29726 might have been a shrewd bear trap, luring sellers into a false sense of security. Should this intriguing notion hold ground and find validation through sustained buyer support during the ongoing consolidation, the stage could be set for a promising bullish reversal. Buoyed by mounting buying pressure, Bitcoin’s price has the potential to surpass the threshold above, potentially even ascending beyond the $31000 mark.
Technical Indicators Signal Bright Spots
- Bollinger Band Support: The Bollinger Band indicator reveals a promising uptrend in the lower band, providing additional support for traders navigating these waters.
- RSI Momentum: A positive sign emerges as the daily RSI slope surpasses the 50% mark, signalling an upswing in bullish momentum that adds credence to the potential for a favourable market shift.


