
Bitcoin’s $30K Support Holds Steady : Is the Bull Cycle About to Begin?
Maintaining support at the crucial level of $30,000 remains of utmost importance for the price of Bitcoin. There is a possibility of a potential surge, initially reaching $33,000, followed by a subsequent increase to $38,000.
Currently, the price of Bitcoin is hovering above the $30,000 mark as consolidation intensifies throughout the cryptocurrency market. Simultaneously, investors eagerly anticipate the release of the US Consumer Price Index (CPI), a respected indicator of inflation. This index will guide the Federal Reserve’s actions, particularly after the suspension of interest rate hikes earlier in June.
Analysts hold differing opinions on how the Bitcoin price will respond to the forthcoming CPI data, scheduled for release on Wednesday. Market expectations indicate a range of approximately 3% for the CPI, which could imply a further reduction in inflationary pressures in the United States, potentially resulting in a continuation of the current pause on interest rate hikes.
Bitcoin and other risk assets benefit significantly from decreased inflation, encouraging investors to seek greater exposure to cryptocurrencies, stocks, and other similar assets. Nevertheless, the support level at $30,000 places Bitcoin in a precarious position, as declines to $28,000 and $25,000 cannot be entirely ruled out.
On the other hand, with accumulation on the rise, BTC could still be poised for an upswing.
Analyzing Bitcoin Market: Bear or Bull
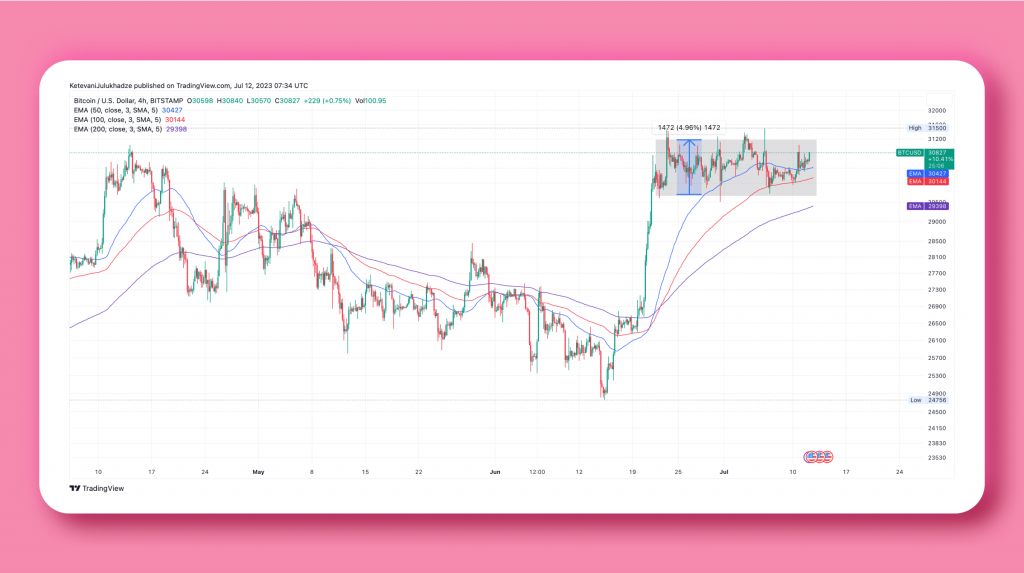
Bitcoin is currently trading within a bullish rectangle pattern on a micro-scale. This chart pattern indicates a break in the uptrend and allows for consolidation before the next bullish breakout.
The breakout would begin with a break above the rectangle resistance (upper boundary) at $31,374. Traders confirm this with a sudden increase in volume and sustained movements above the resistance.
Investors look for a breakout target equal to the pattern’s width and extrapolate above the upper boundary in this case. Traders with long positions in BTC would be looking for a 5% move to $33,000.
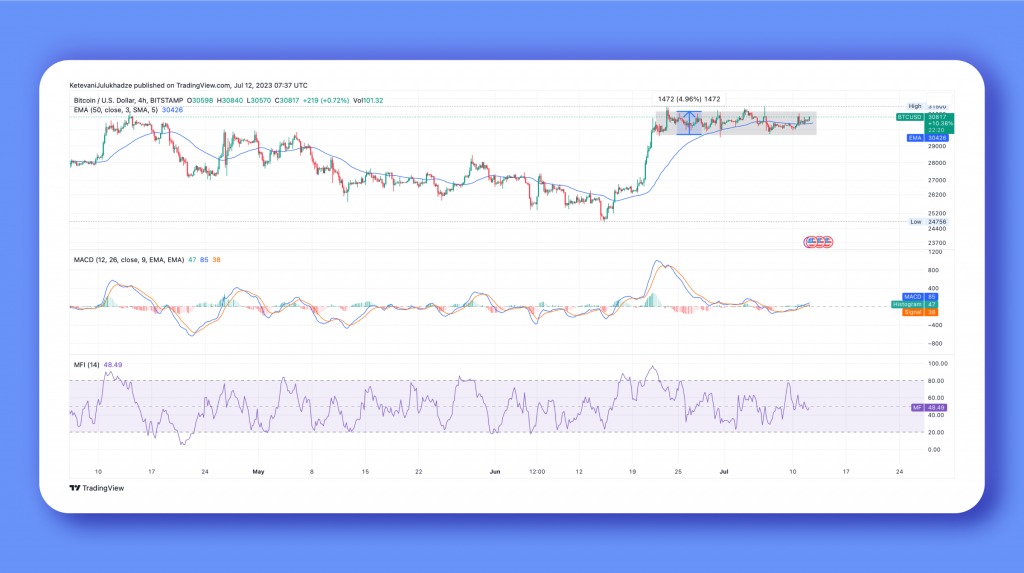
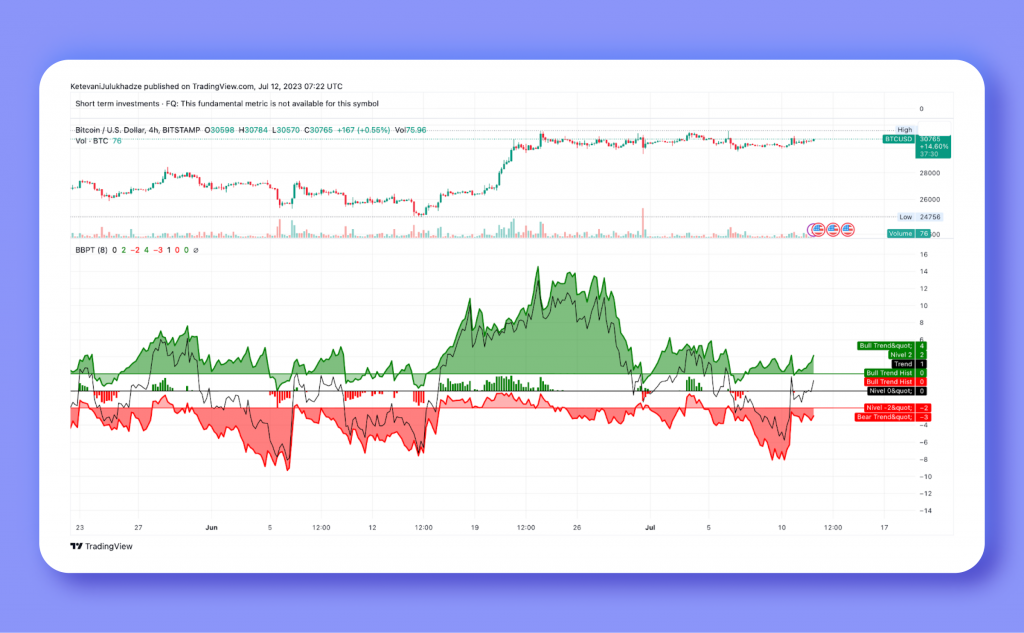
The rectangle pattern and a bullish signal from the Money Flow Index (MFI) lend credence to a possible break above $33,000. After falling from the overbought region above 80 to 35, the MFI is climbing again. This indicator measures the strength of money inflows and outflows in Bitcoin markets.
Is a Bitcoin Bull Market on The Horizon?
According to Tim Frost, CEO of Yield App, a digital wealth management platform expected to launch in 2022, the crypto market has greatly improved from the doldrums of 2022.
“In 2024, following a period of continued consolidation this year and, behind closed doors, huge innovation is paving the way for the next wave of crypto adoption.”
Glassnode, in a recent report on bull market corrections, said that
“The peak drawdown in 2023 has been just -18%, which is remarkably shallow compared to all prior cycles.” The on-chain analytics platform attributed this technical outlook to “a relatively strong degree of demand underlies the asset (BTC).”
A thorough examination of market data revealed that, despite the unpredictability and changes seen thus far, Bitcoin is still showing clear signs of recovery and remains strong in the current cycle.
Bitcoin price support at $30,000 remains critical, with a possible first spike to $33,000. On the other hand, drops below the immediate support may result in losses to $28,000 before another bullish breakout.


