
Price Analysis 7/24: Bitcoin’s 50-Day SMA Support and its Ripple Effect on Altcoins
On July 25, Bitcoin experienced a sharp decline to $29,000, indicating an attempt by bears to take control of the market. This drop seems to have enticed short-term bulls to take profits and encouraged aggressive bears to enter short positions.
Despite the near-term bearish sentiment, long-term investors remain unaffected and continue to hold onto their Bitcoin positions. Glassnode data reveals that Bitcoin’s long-term holder supply has reached a new high of 14.52 million Bitcoin, equivalent to 75% of the total circulating supply.
While the cryptocurrency markets may be facing some softness, the United States equities markets are showing strength. The Dow Jones Industrial Average has enjoyed a 10-day streak of gains, the longest since 2017. However, this trend could change this week as key earnings reports and the Federal Reserve’s policy decision on July 26 could potentially impact the markets. The outcome of the Federal Reserve’s decision may also influence the U.S. Dollar Index (DXY), which is currently on a recovery path.
Can lower prices be attractive for buyers of Bitcoin and certain alternative cryptocurrencies? Will the resilience of the US stock markets prevent significant declines in the cryptocurrency markets? Let’s examine the charts to determine the answer.
S&P 500 Index
On July 19, the S&P 500 Index (SPX) experienced a decline from its peak at 4,578. However, a promising sign is that the bulls have not surrendered much ground despite the dip. This indicates that buyers are holding onto their positions, showing confidence in the potential continuation of the uptrend.
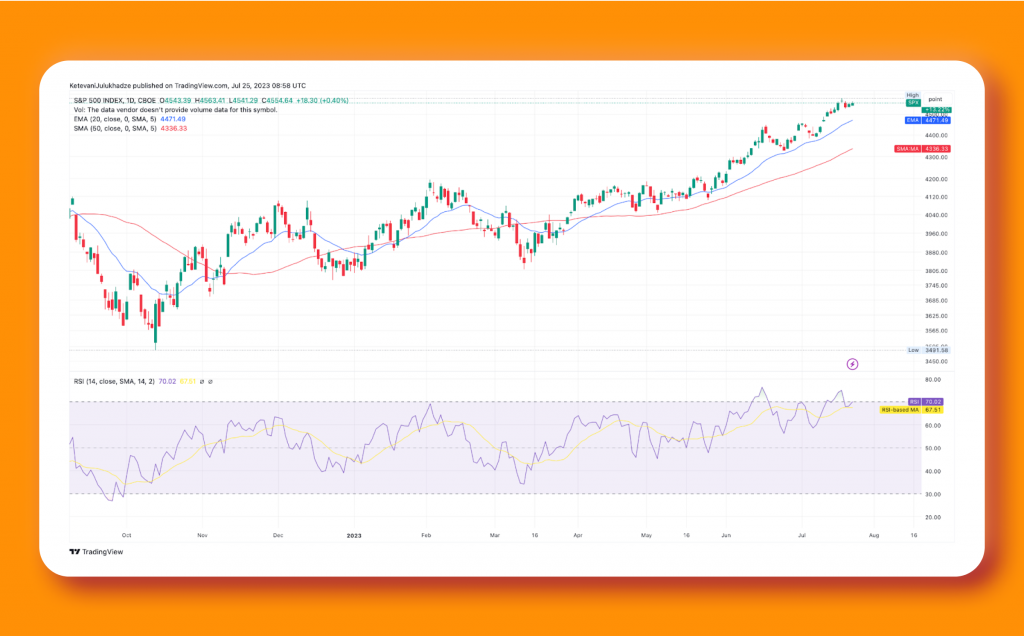
The 20-day exponential moving average (EMA) stands at 4,471, and the relative strength index (RSI) is in the overbought territory, suggesting that the bulls are currently in control. If the price rebounds from the level of 4,513 or the 20-day EMA, it will signal that buyers are still interested in lower levels, further supporting the likelihood of a breakthrough above 4,578. In such a scenario, the index could rally towards 4,650 and potentially even reach 4,800.
However, this optimistic outlook would be invalidated if the price drops below the 20-day EMA. Such a development might pave the way for a decline towards the 50-day simple moving average (SMA) at 4,336.
Bitcoin
On July 23, Bitcoin bulls pushed the price above the 20-day EMA, which was at $29,957 then. However, a long wick on the candlestick indicated strong selling pressure at higher price levels.
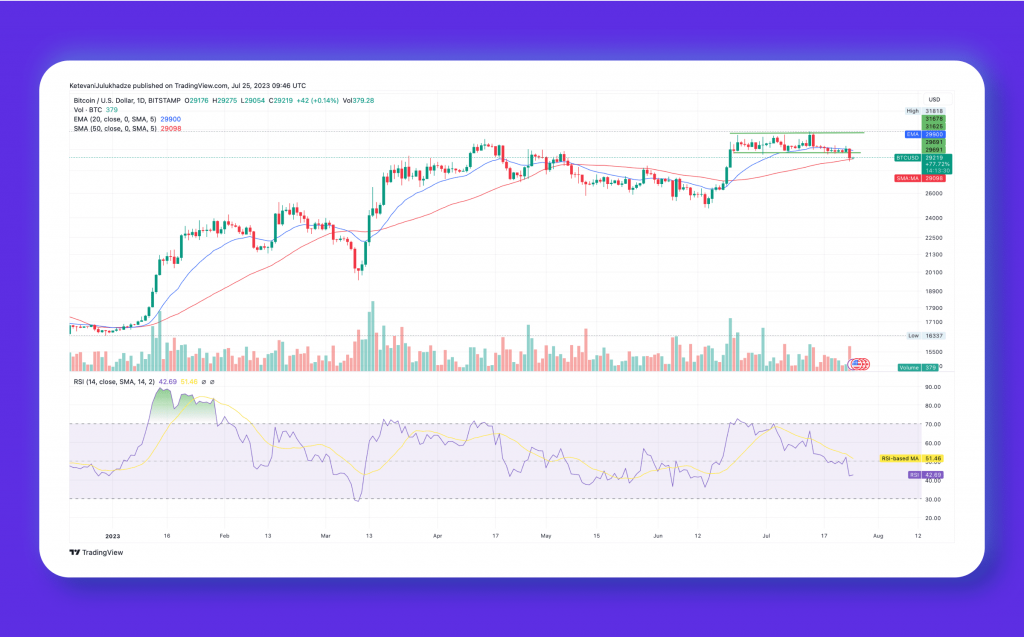
Unfortunately, the selling intensified on July 25, causing the price to drop below the significant support level at $29,220, which had been holding for several days. As a result, the BTC/USDT pair declined to the 50-day SMA, standing at $29,098, which is now a critical level to monitor closely.
If the price bounces back from the current level and surpasses the 20-day EMA, it may suggest that the recent break below support was a bear trap. This could potentially lead the pair to rally towards the $31,000 mark. However, traders and investors should be cautious and vigilant about how the price behaves around these key levels.
Ethereum
On July 25, Ether (ETH) experienced a bounce from the 50-day SMA, which was at $1,853. The bulls attempted to push the price above the 20-day EMA at $1,886, but the bears successfully resisted.
The bears are striving to maintain the price below the 50-day SMA. It could initiate a more significant correction towards the $1,700 level if they succeed. Such a decline would indicate that the ETH/USDT pair might continue trading within the range of $1,626 to $2,000 for a prolonged period. During this phase, price action within the range will likely be unpredictable and volatile.
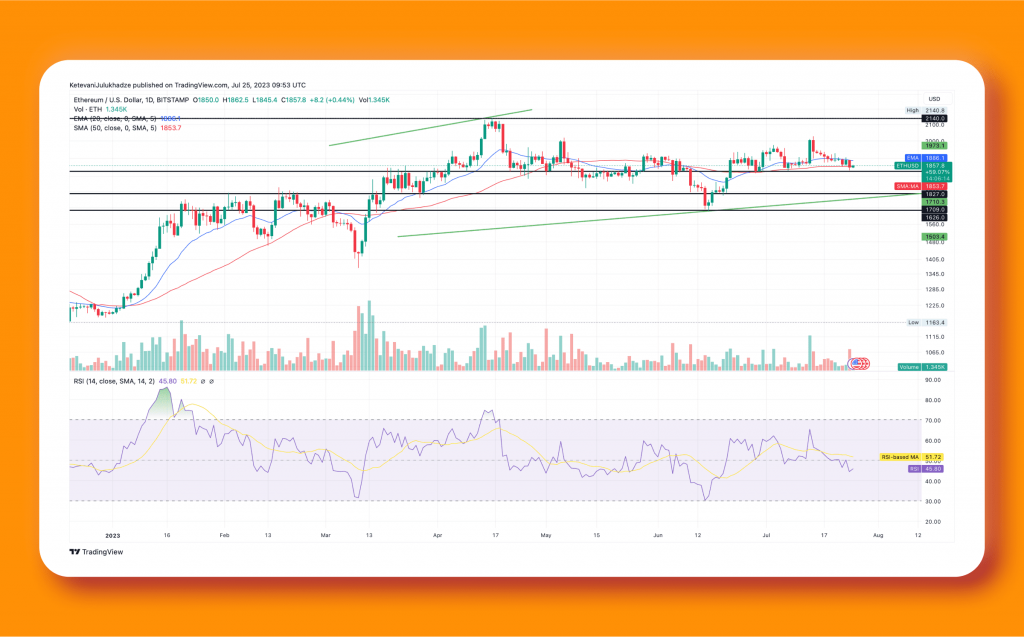
However, if the price rebounds from the 50-day SMA and rises above the 20-day EMA, it would indicate strong buying interest at lower price levels. This scenario could potentially lead to a rally towards the $2,000 mark. The next significant price movement will commence on a break above $2,000 or below $1,626.
XRP
XRP (XRP) attempted to sustain above $0.83 on July 19 and 20 but was unsuccessful, leading to a downturn towards the 20-day EMA, which was at $0.67.
The bulls must vigorously defend the 20-day EMA to maintain the current uptrend. A strong rebound from this level may result in the XRP/USDT pair establishing a range in the short term.
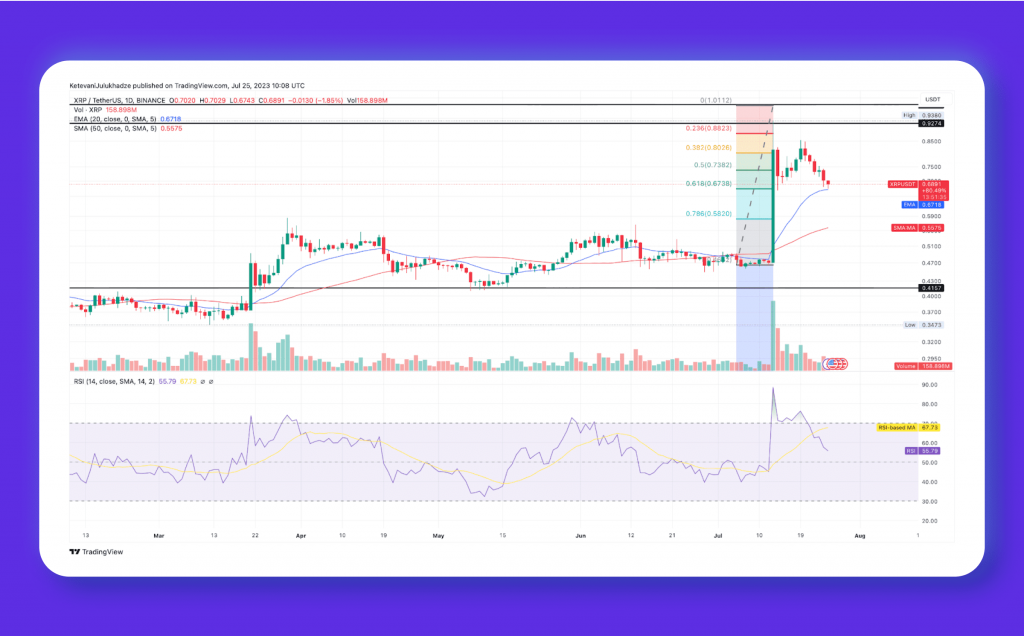
This potential range could have support at $0.66 and resistance at $0.86. The first strength signal would be a clear breakout and close above the overhead resistance at $0.86.
On the other hand, if the price breaks below the 20-day EMA, it would suggest that bullish momentum is weakening, and traders may start selling. This could trigger further selling pressure, potentially causing the pair to decline towards the breakout level of $0.56.
Cardano
The Cardano ADA token, priced at $0.307, is currently experiencing a tough and closely contested battle between the bulls and the bears near the 20-day EMA, which is at $0.31.
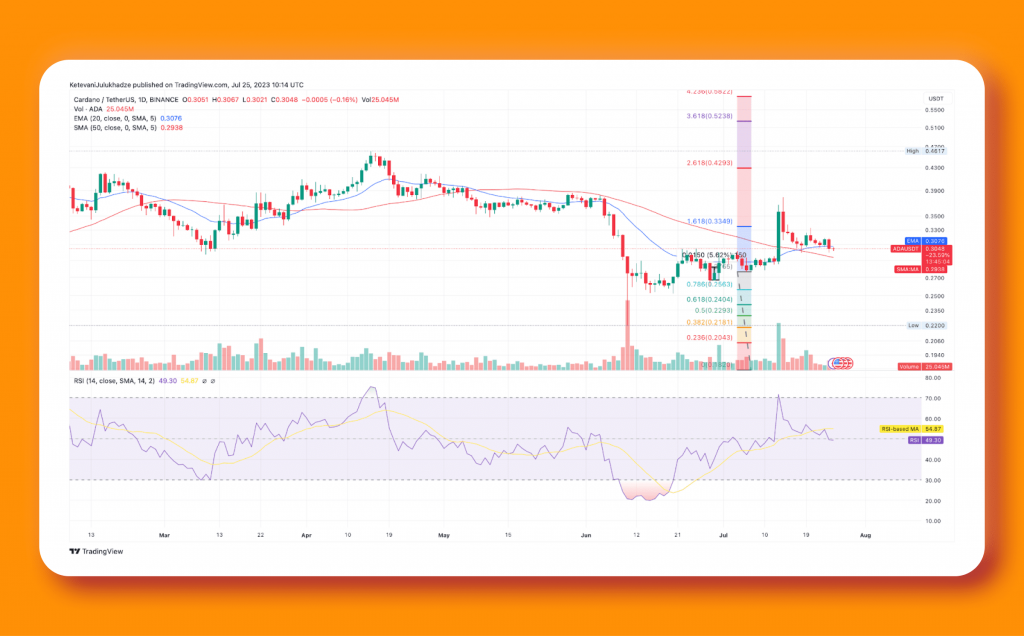
The situation is characterised by a flattening 20-day EMA and the RSI hovering around the midpoint, making it difficult to determine a clear advantage for buyers or sellers. This uncertainty would favour the bears if the price drops below $0.30, potentially leading to a decline towards the uptrend line.
Conversely, if the buyers drive the price above $0.33, it would signal a resurgence of bullish strength. In such a scenario, the ADA/USDT pair could rally towards the July 14 intraday high of $0.38. However, the bears will likely build a strong defence around this level to prevent further gains.
Polygon
The Polygon MATIC token, priced at $0.7244, has been hovering near the 20-day EMA at $0.74 for the past few days. Although the bulls are trying to defend this level, they have not been successful in initiating a recovery, indicating sustained pressure from the bears.
The 20-day EMA is flattening, and the RSI has dipped below 50, signifying a balance between supply and demand in the market. If the price plunges below the 50-day SMA, this equilibrium might favour the bears. The MATIC/USDT pair could slide down to the support level of $0.60 in such a scenario.
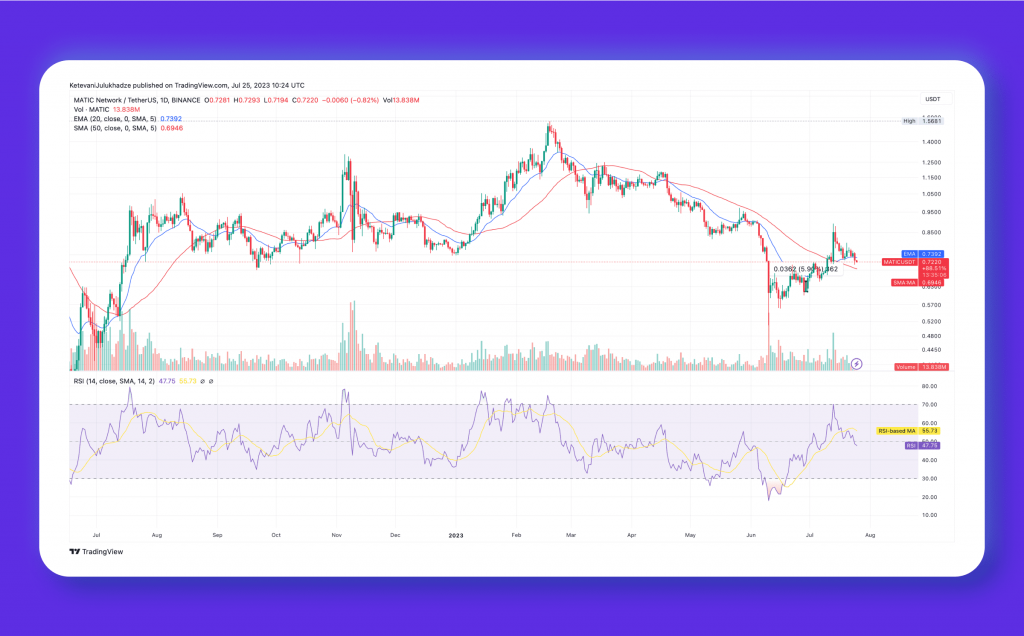
Conversely, if the price rebounds from the current level and rises above $0.80, it would signal significant buying interest at lower levels. This could lead the pair to retest the local high at $0.89. A successful breakthrough above this level might indicate the continuation of the uptrend.


