
Bitcoin’s Daily Chart Analysis: Exploring Stability, Volatility, and the Chance for a Strong Recovery
As of August 9th, Bitcoin’s daily chart analysis reveals a resilient stance at $29,777 in the current trading session. This price point underscores Bitcoin’s notable stability within the $29,000 to $30,000 range, a consolidation period that has persisted over recent weeks.
A critical factor influencing this phase is the anticipation of regulatory clarity within the United States, poised to serve as a potential catalyst for a breakthrough beyond the $30,000 mark. Despite a modest 1.8% uptick, registering a trading volume of $18 billion and a substantial market capitalisation of $577 billion, the lingering challenge lies in the record low volatility.
Daily Chart From Tradingview: Is the $30k Critical Level For Bitcoin?
Bitcoin’s persistent proximity to the $30,000 threshold carries notable implications, suggesting a significant zone that can trigger a substantial upward surge, aiming for a notable $40,000 breakthrough.
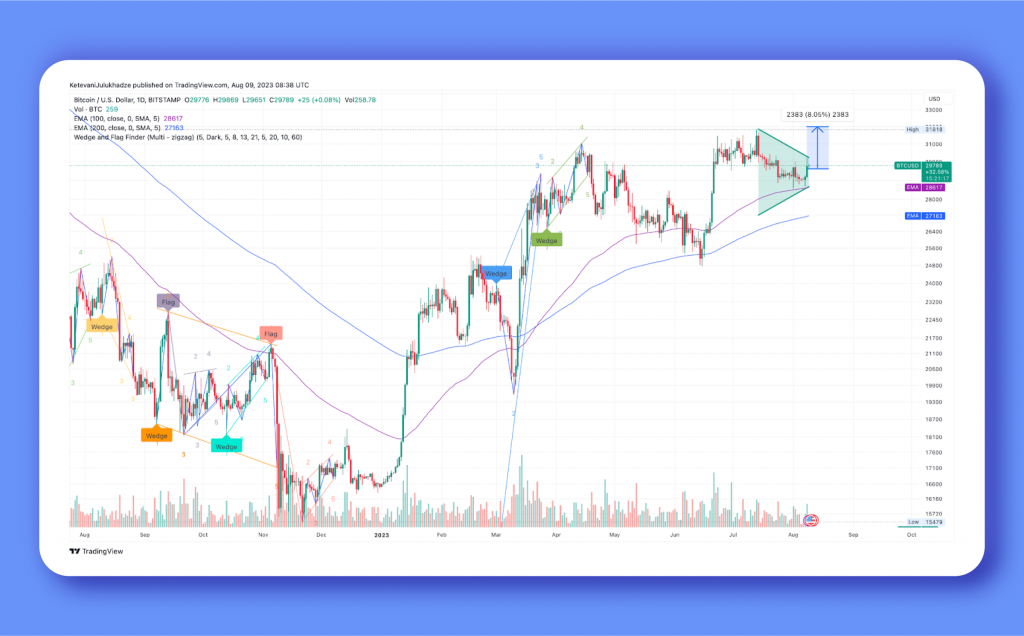
The daily chart unveils a compelling falling wedge pattern, pointing towards an imminent breakout that could transpire over the short term. This bullish pattern is a potential signal for a trend reversal or continuation. The pattern emerges as the price forms lower lows and lower highs within a gradually narrowing range, forming a wedge-like configuration.
To illustrate, it is advisable to consider entering a long position upon the price’s close above the upper trend line, positioned near the pivotal $30,000 mark. A prudent approach involves setting a stop-loss just above the most recent higher low, slightly surpassing the $29,000 level.
Furthermore, traders can utilise the wedge’s height to define their profit-taking target. In this scenario, projecting an 8.78% extension from the breakout point would potentially lead to highs reaching approximately $32,247. This strategic use of chart patterns and key levels offers a comprehensive framework for navigating the current Bitcoin landscape.
Exploring Bullish Potentials for Bitcoin Price
Amidst a relatively subdued crypto trading landscape, Bitcoin’s bullish potential remains evident, poised to breach the $30,000 mark this week.
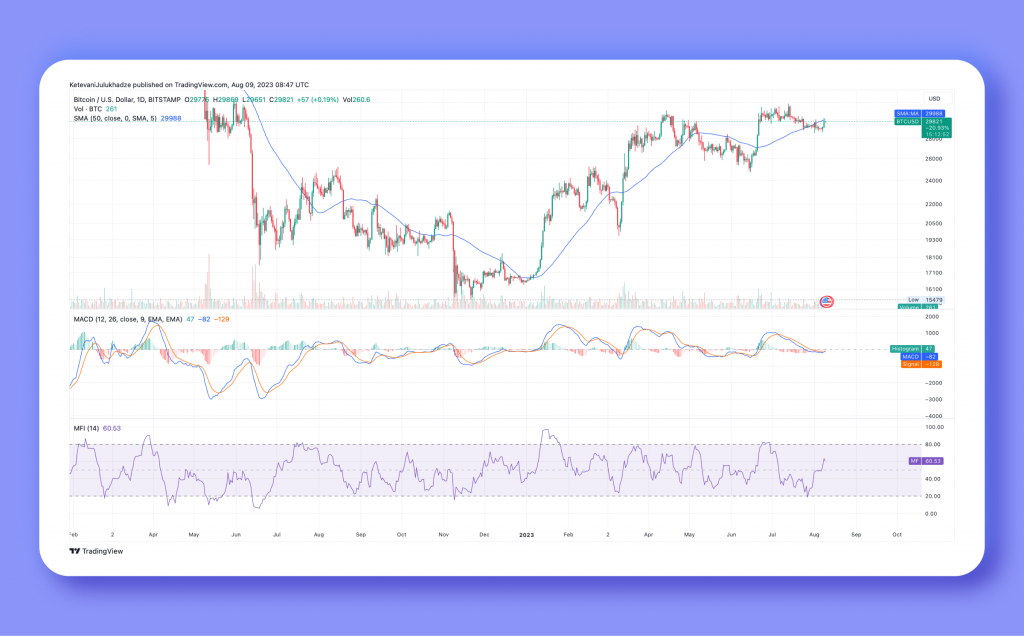
The Moving Average Convergence Divergence (MACD) indicator is advised, as the upcoming breakout from the falling wedge pattern could gain momentum upon the MACD blue line crossing above the red signal line. Close monitoring of sustained breaks above $30,000 is crucial to gauge their viability and avoid potential bull traps. Notably, the Money Flow Index (MFI) underscores buyer dominance, evident through substantial capital inflow into Bitcoin markets, outweighing outflows.
- MACD indicator’s blue line crossing above the red signal line signals a potential rapid breakout from a falling wedge pattern.
- MFI indicates buyer strength, with substantial capital inflow into Bitcoin markets outweighing outflows.
Potential support at $29,345, reinforced by the 50-day EMA (red), offers a buffer against retracements and bears. However, vigilance is warranted as a breach of this level could exacerbate the bearish scenario, potentially impacting the $29,000 support and opening the door for further declines to $28,000 and $25,000.


