
Cardano Price Prediction – Why ADA Dropped 20% After The Trump Strategic Reserve News
Trump’s arrival at the White House was accompanied by a surge in most cryptocurrencies, given his pro-crypto stance. Major coins, like BTC and ETH, and altcoins saw higher interest in 2025, driving prices higher.
The recent Trump crypto strategic reserve news drove some altcoins, especially ADA, SOL, and XRP, even higher. Cardano witnessed the most intense rally, dipping by 20% in one day after skyrocketing beyond the $1 mark for the first time since April 2022.
Is it time for a new crypto bearish movement? Why is ADA going down? Let’s explore Cardano price prediction in this analysis.
Cardano (ADA) Price Surge
Ever since Cardano peaked in 2022, the coin failed to revisit its previous levels, trading under $0.50 for the last two years. Hope was restored after announcing the new US president in 2024 and discussing new crypto ETFs. These factors drove most cryptocurrencies higher and ADA to $1.00 – $1.10 between December and January.
In February, as investors focused on major coins and other investments, ADA lost half of its gain, dropping to $0.60 – $0.70.
Cardano (ADA) price surged in March, growing over 70% in one day between the 2nd and 3rd of March. However, a price correction on the 4th saw the coin falling to the $0.80 – $1.00 zone.
The Trump Crypto Strategic Reserve Announcement
In December 2024, the US President announced the creation of the Bitcoin Strategic Reserve, aiming to position the United States as a leader in the digital asset space, spurring a $100,000 BTC price surge.
On the 2nd of March, Trump offered an update on the strategic reserve plan, creating a Presidential Working Group and adding Ripple, Solana, and Cardano to the mix.
This news drove more interest into ADA, increasing buying pressures and sending the coin to new levels, peaking at $1.13 on the 3rd of March.

Cardano Price Prediction
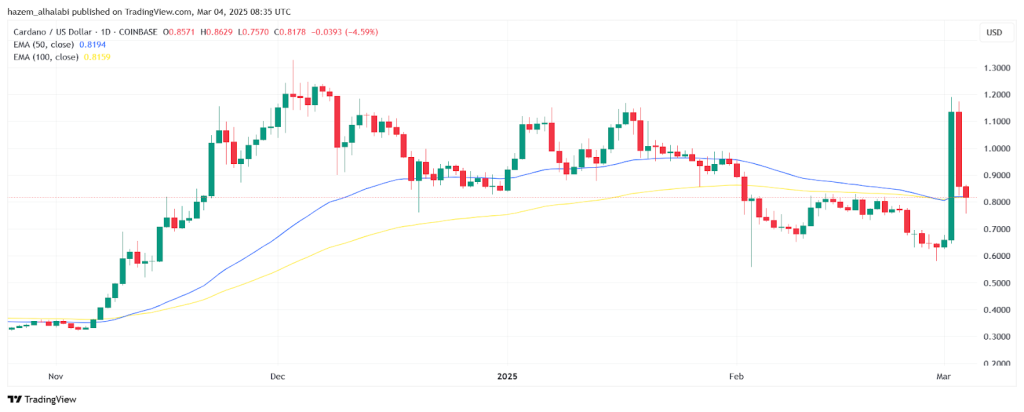
Let’s analyze the ADA coin price movement using the Exponential Moving Average indicator across two different time periods.
Starting with the long-term analysis between the 50 and 100 historical prices, we see how the price was moving well under both EMA lines during the February bearish movement.
However, at the beginning of March, the price skyrocketed and crossed substantially above both EMA lines, indicating a significant bullish rally. At the same time, we see how both EMA indicators merge and move horizontally without a prominent upward movement.
This suggests that the ongoing surge is more likely to settle in the coming days but could still trend higher than average.
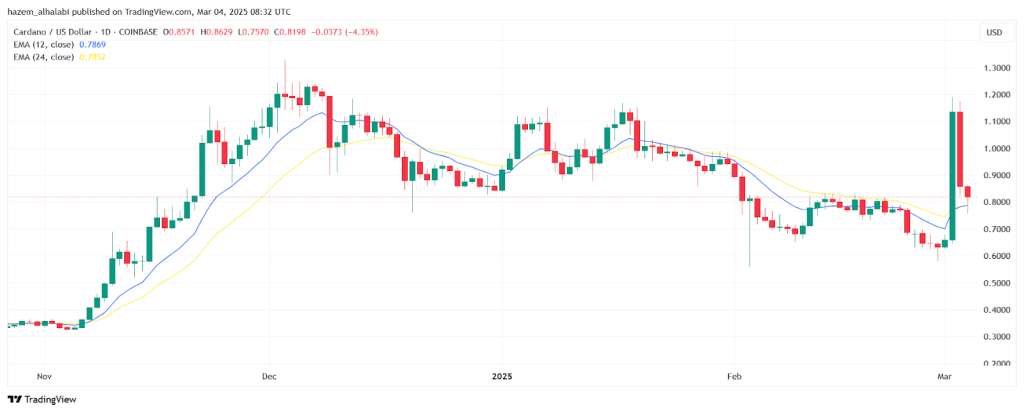
We continue the Cardano cryptocurrency price action analysis using the 12- and 24-day values. Here, we see a similar picture of how the price broke above both EMA lines.
However, we see a stronger upward trajectory here, indicating that the current bullish trend can last a few days before correction or a dramatic change, such as increasing buying pressures in the Cardano price prediction next bull run.
Final Takeaways
ADA coin surged significantly after Trump announced adding Cardano to the US Strategic Reserve, driving prices to the $1 zone after two years. However, this bullish movement was quickly settled, as the coin lost 20% of its gains in one day.
At the same time, technical Cardano price prediction suggests that ADA is more likely to trade higher for a few days, waiting for more buyers to join and set the support level higher. Otherwise, a correction is expected.
Disclaimer: This article is for informational purposes only. It is not finance advice and should not be relied upon for investment decisions. Always do your own research and consult a financial advisor before investing.


