
Ethereum’s Steep Climb: Will it Sustain or Correct in the Near Future?
On July 13th, the price of Ethereum successfully surpassed the weekly resistance level of $1966, indicating a continuation of the upward trends. Nevertheless, the price encountered strong selling pressure upon reaching the psychological resistance at $2000, causing it to drop below $1966.
The unsuccessful breakout of recent weeks indicates that the rally was largely influenced by market sentiment rather than the inherent strength of Ethereum itself.
Analyzes Of Daily Chart
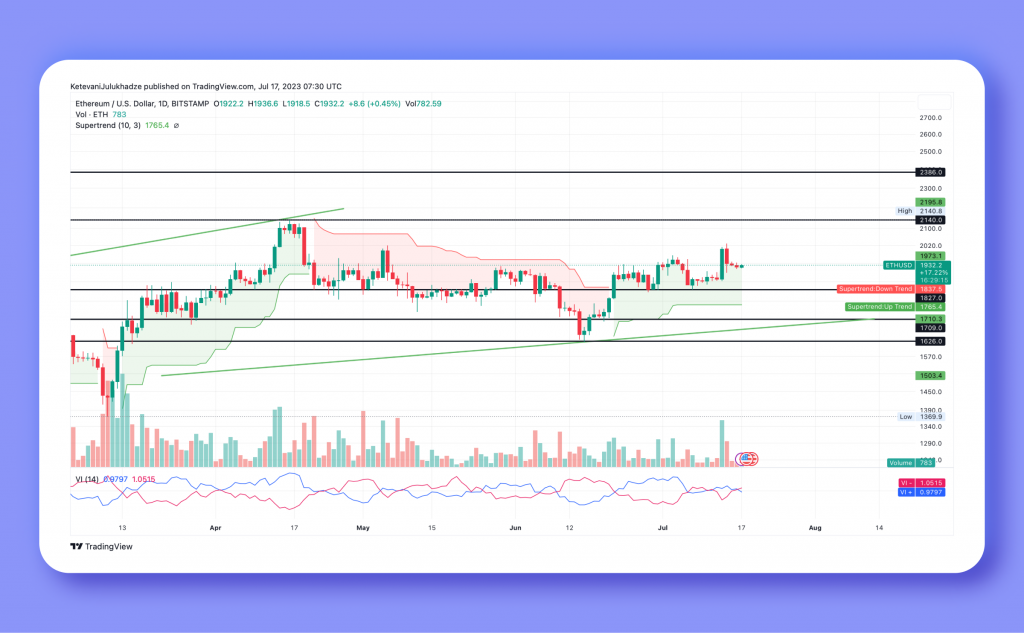
The $2000 level has proven to be a strong resistance zone for buyers in the Ethereum price. The rising channel pattern supports the long-term bullish trend in ETH. Ether saw a significant increase in trading volume, with an intraday trading volume of $134 billion, representing a gain of 134%.
The failure of Ethereum’s price to sustain above $1966 has resulted in trapping hasty buyers who entered the breakout trades. This kind of bull trap is considered a robust bearish signal, as it often leads to the liquidation of trapped buyers and brings more selling pressure into the market.
Ethereum’s price is currently trading at $1932, experiencing a slight intraday increase of 0.43%. If selling pressure continues, there is a possibility that the price could decline by 7.5% and retest a local support level at $1830. This support level has proven to be a buying opportunity for traders over the past three weeks and has helped maintain the ongoing recovery rally.
Furthermore, it is worth noting that the ETH price is still forming higher highs and higher lows, indicating that the bullish trend remains intact.
Prediction Of Ethereum’s Rising
Given the current rising channel pattern governing the bullish trend in Ethereum price, the support trendline within this pattern provides an ideal level for accumulation. However, if sellers manage to breach below this trendline, it could potentially change market sentiment. Based on this pattern, the ongoing recovery cycle is anticipated to reach the overhead trendline near the $2400 mark.
The Vortex indicator, there is a possibility of a bearish crossover between the VI+ (blue) and Vl (orange) slopes, indicating a potential loss in bullish momentum.
On the other hand, the Super Trend indicator displays a green film, emphasizing that the overall market trend remains bullish.


