
Price analysis 6/19: BTC, ETH, BNB.
Bitcoin has reclaimed the $26,000 level, but will large-cap altcoins follow suit?
Currently, Bitcoin is experiencing a notable challenge as buyers and sellers engage in a high-stakes duel near the $25,000 milestone. Notably, the news that BlackRock has submitted an application for a Bitcoin exchange-traded fund with a value of BTC 26,426 has not boosted prices. This observation implies that potential investors exhibit reserved optimism due to regulatory uncertainties.
Bitcoin Price Analysis
On June 15, the value of Bitcoin abruptly fell below a significant support level of $25,590, which suggests that there was a significant amount of selling activity by bearish traders.
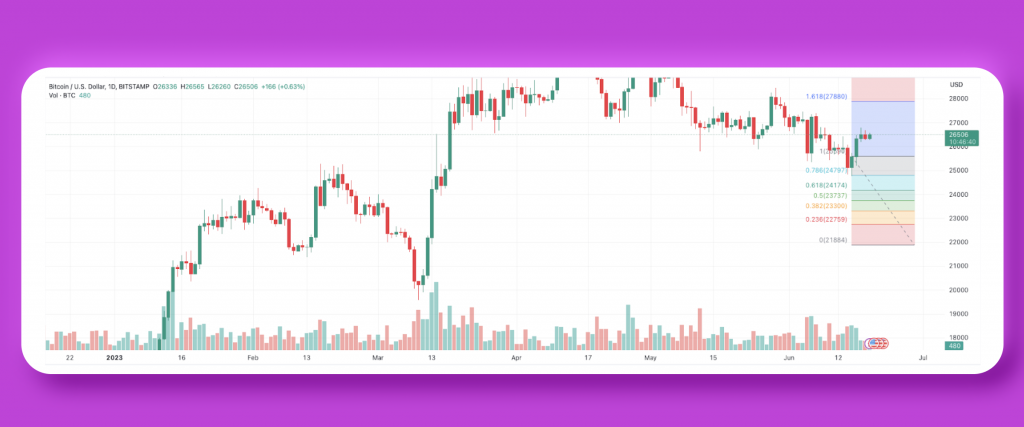
BTC/USDT daily chart. Source: TradingView
On June 19, the price of BTC/USDT reached $26,426 thanks to bullish activity. However, the bulls face a challenge at the 10-day exponential moving average (EMA) of $26. To initiate a meaningful rebound, they must overcome this obstacle. If successful, the pair may attempt a rally to the 50-day simple moving average (SMA) of $27,210 and subsequently to the resistance line of the descending channel.
On the other hand, if the price turns down from the 20-day EMA, the bears will likely try to sink the pair to the support line of the channel. The bulls will undoubtedly do everything they can to defend this level because a break below it may open the door for a crash to the psychologically critical level of $20,000.
Glassnode co-founders Yann Allemann and Jan Happel recently shared on Twitter that a technical analysis indicator and two on-chain indicators for Bitcoin are showing a resemblance to Q3 2020, just before Bitcoin’s record-breaking surge past $20,000. As such, it begs the question – is a potential market rebound on the horizon? To explore this further, we analyzed the charts of the top 10 cryptocurrencies.
Ether Price Analysis
The current market conditions show that the bulls are attempting to drive the price more above $1,700. However, it is expected that the bears will strongly defend this level. If the price falls below $1,600, there is a greater likelihood that the ETH/USDT pair will drop further to $1,352, which is a key support level.
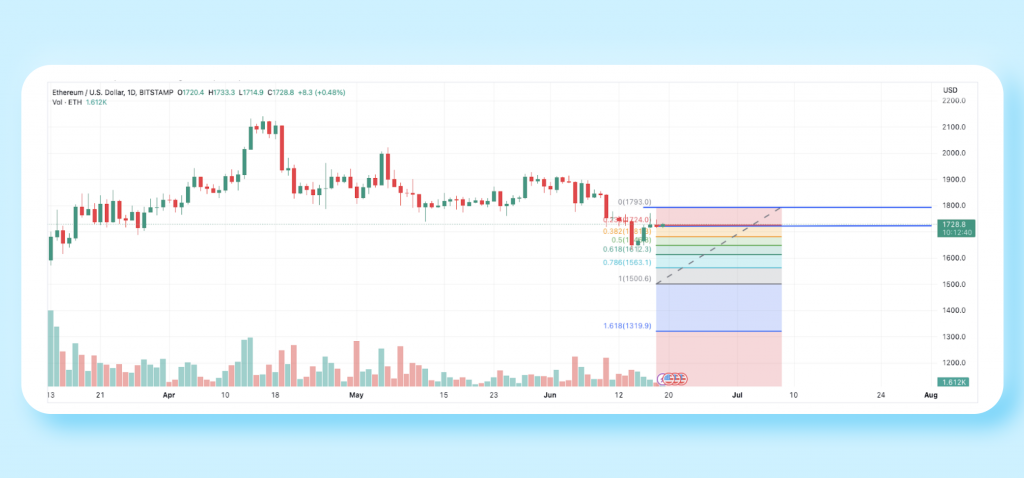
ETH/USDT daily chart. Source: TradingView
On the other hand, if the pair successfully climbs above $1,700, this would indicate substantial demand at lower levels. This could potentially lead to a rise up to the 20-day EMA ($1,793), where the bears will attempt to halt the momentum. If they are unsuccessful, the pair may rally to $1,793 and even reach $2,000. These are both significant milestones that could indicate a bullish trend for the cryptocurrency market.
BNB Price Analyze
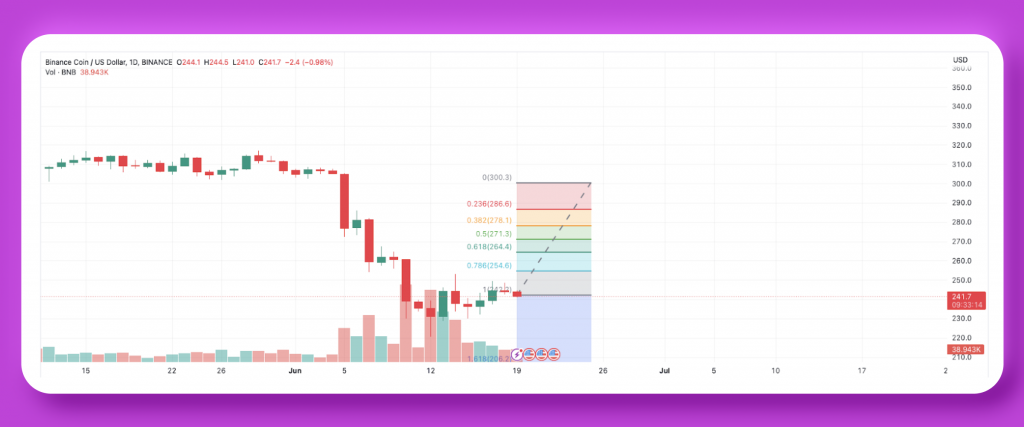
BMB/USDT daily chart. Source: TradingView
Currently, the price of BNB is at $241.6 USD. Previously, the price experienced a rebound but failed to sustain momentum at the 38.2% Fibonacci retracement level of $252.50 on June 14. This indicated that selling pressure from bears persisted during minor rallies.
The critical level to watch is $220. Should the bears successfully push the price below this level, it could trigger the start of the next downward movement for the BNB/USDT pair, potentially leading to a collapse towards the crucial support level at $183.
On the other hand, there is also a possibility that the bulls step in and buy the dips near the $220 support level. In this scenario, the pair may fluctuate between the range of $252 and $220 for a certain period. If buyers manage to drive the price above $252, the pair might ascend towards $265. However, it is anticipated that bears will once again mount a strong defence at that level
Bottom Line
The market of cryptocurrency is known to be highly volatile, requiring investors to stay updated with the dynamic nature of this field. Prices and statistical facts can undergo significant changes within a single day, hence, investors must keep a vigilant eye on market movements. Technical analysis and various indicators can aid in decision-making however caution must always be exercised, and impulsive decisions based solely on short-term fluctuations must be avoided. By combining careful analysis with a long-term investment strategy, success can be achieved in this ever-changing market.


