
Altcoin Season Index Explained: A Trader’s Guide to Market Cycles
Bitcoin is holding strong above $100k, fueled by institutional buying, but the rest of the market remains quiet. This is the exact moment traders start watching for the next big move: a rotation of capital from a stable Bitcoin into the world of altcoins, kicking off a potential “altseason.”
Trying to guess when this shift will occur is often a losing game. For this reason, tools like the Altcoin Season Index (ASI) were created. They aim to provide a data-driven perspective on this market dynamic.
This guide explains the index’s calculation method, its important link to Bitcoin Dominance, and how it can be used to inform strategic decisions.
Key Takeaways
- The index essentially monitors the performance battle between Bitcoin and top altcoins, reflecting when the market’s appetite for risk is high enough to fuel altcoin growth.
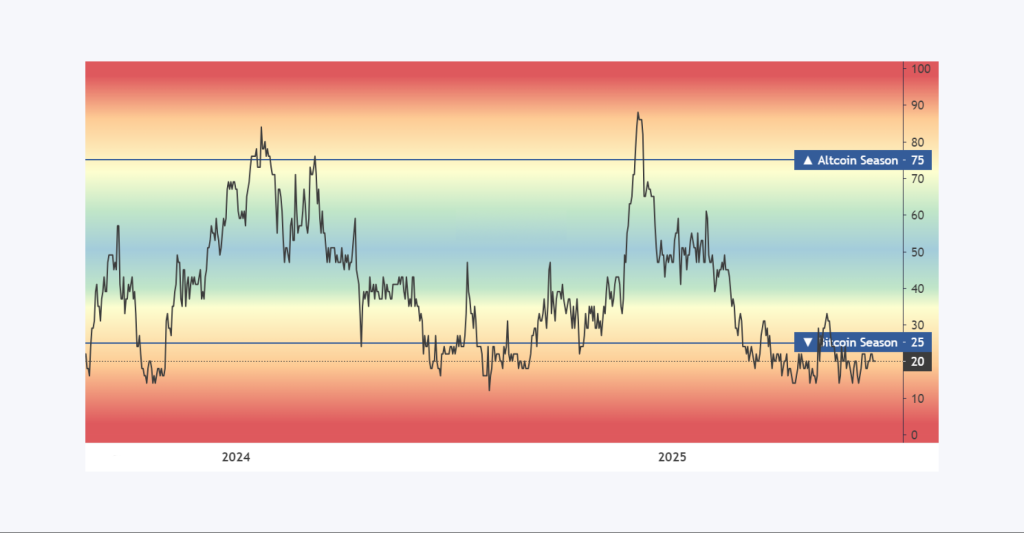
- ASI defines the market’s “season” based on a 90-day performance test: an Altcoin Season is active above the 75% mark, while a Bitcoin Season is confirmed below 25%.
- ASI looks at the past data, so its main function is to confirm the strength of the current trend, not to forecast where the market will go next.
Altcoin Season Index Explained
The crypto market moves in distinct “seasons.” Sometimes, Bitcoin dominates all the attention and capital. At other times, money flows aggressively into smaller cryptocurrencies, creating an “altcoin season.” The Altcoin Season Index is a simple tool designed to act as a weather report for these market cycles.
A Simple Gauge for a Complex Market
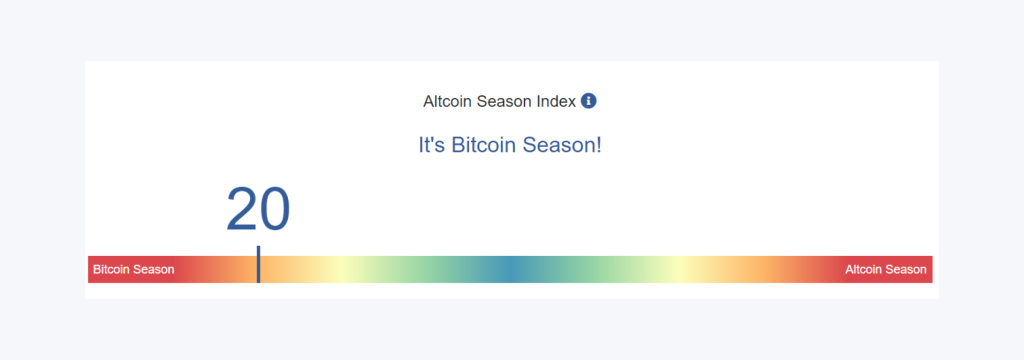
At its core, the Altcoin Season Index is a data-driven metric. It measures the performance of top altcoins relative to Bitcoin. Its main purpose is to answer a single question: Is it more profitable to hold Bitcoin right now, or a basket of the best altcoins? This complex market dynamic gets visualized as a simple number.
The index is on a scale of 0 to 100. A low score, particularly below 25, is what signals a “Bitcoin Season.” In this environment, Bitcoin is significantly outperforming most altcoins. Capital tends to consolidate into the market leader, which indicates a more “risk-off” sentiment.
A score of 75 or higher, conversely, is the official signal for an “Altcoin Season.” What does this mean? That a large majority of top altcoins are beating Bitcoin’s performance. It’s a clear sign of bullish market sentiment and a strong appetite for risk among traders. This is the period most associated with explosive altcoin trading.
The Mechanics of the Index: A Simple Breakdown
The Altcoin Season Index isn’t based on opinions or social media chatter. Its strength comes from its formula: simple, transparent, and based on data. That formula needs just two inputs: a specific list of top altcoins, and a timeframe to check their performance against Bitcoin.
The 90-Day Performance Window
To define a “season,” the index looks back over a 90-day period. For each altcoin, it asks one simple question: Did it beat Bitcoin over the last 90 days? Using a 90-day window is usually long enough. It helps capture a real trend, not just short-term market noise.
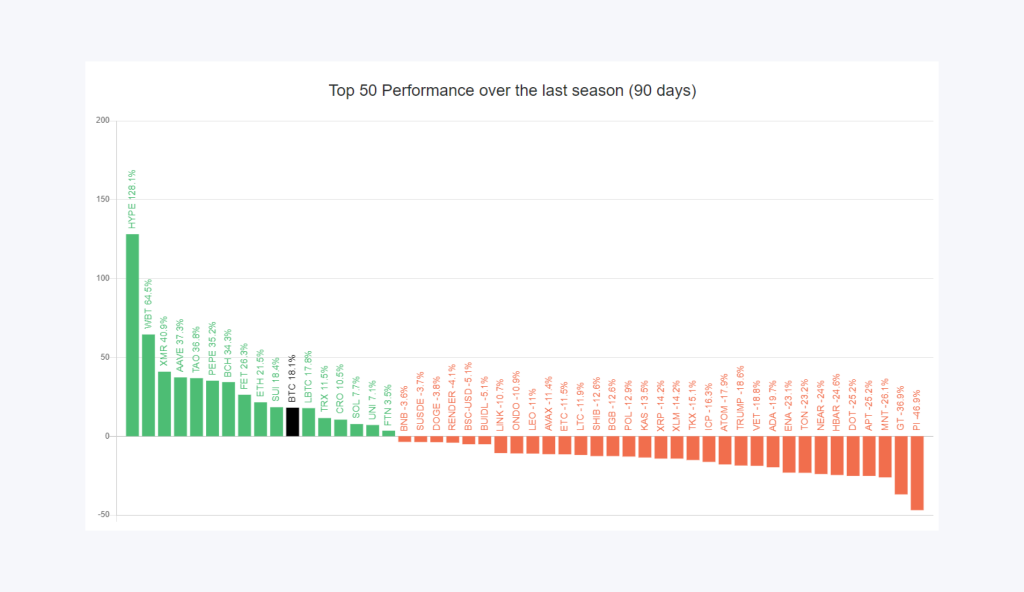
The most popular version of the index (from Blockchaincenter) uses a basket of the top 50 altcoins by market cap. A key detail: this list purposefully excludes stablecoins like USDT and any asset-backed tokens. The goal is to make sure the comparison is purely between speculative crypto assets.
The “75% Rule”
Once all 50 altcoins are compared against Bitcoin, the final calculation is direct. It simply checks if at least 75% of them (38 out of 50) beat Bitcoin’s performance over the last 90 days. The market state is determined by this one rule.
If the condition is met, the index crosses above 75. That signals an “Altcoin Season.” If the number is lower, the index points to a neutral or “Bitcoin Season” state. This clear threshold is the core of how to calculate altcoin season index.
The Engine of Altseason: What Is a Bitcoin Dominance?
While the Altcoin Season Index shows what is happening, another metric, Bitcoin Dominance (BTC.D), helps explain why. When you understand how these two indicators interact, you can get a clearer picture of the market’s capital flows and its general health.
What Exactly Is Bitcoin Dominance?
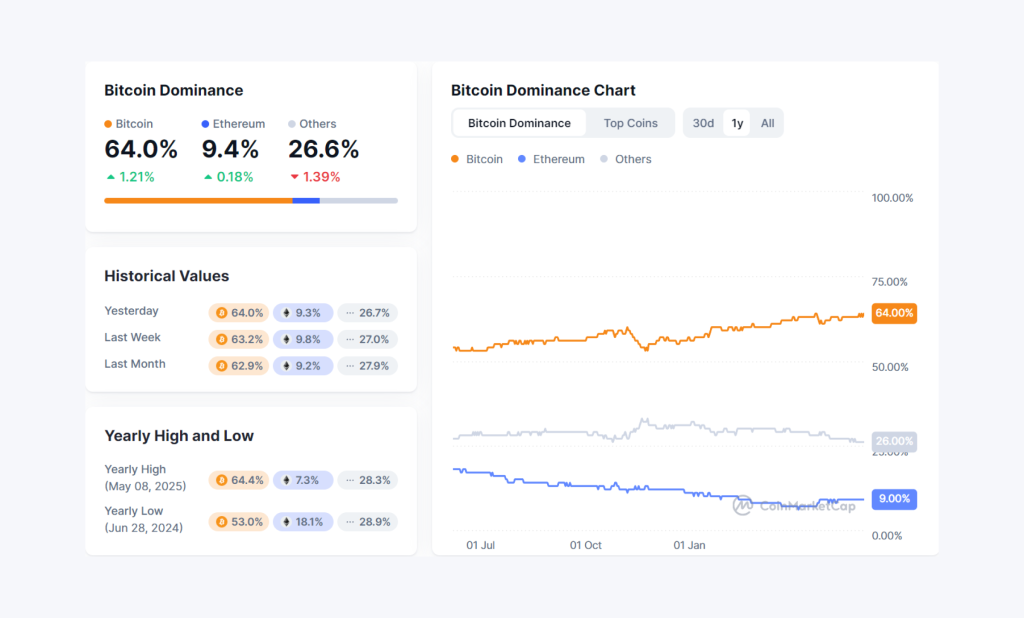
Bitcoin Dominance simply shows what percentage of the total crypto market cap belongs to Bitcoin. Think of it as the clearest way to measure Bitcoin’s weight and influence across the crypto market. A high BTC.D means Bitcoin is in control; a low BTC.D means altcoins are gaining ground.
Here’s the key relationship: a drop in Bitcoin Dominance often comes just before or during an altcoin season. A falling BTC.D chart is a strong clue. It suggests money is moving out of Bitcoin and into altcoins, chasing bigger potential gains.
Reading the Market Dynamics
What’s the perfect setup for a big altcoin season? A Bitcoin price that is stable or climbing slowly, while its dominance is dropping. This setup usually means new money is coming into crypto. And it’s flowing right into altcoins, which creates the potential for broad, explosive growth.
One word of caution. If you see both Bitcoin’s price and its dominance falling at once, that is rarely a good sign for altcoins. It’s more likely a market-wide panic. Investors are probably selling everything—both Bitcoin and altcoins—and fleeing to cash or stablecoins.
We saw this play out perfectly at the start of the 2024-2025 altseason. The Altcoin Season Index crossing above 75 was confirmed by Bitcoin Dominance decisively breaking below the 57% level, showing both indicators working in perfect tandem to signal a major market shift.
Using the Index as a Strategic Tool
A critical rule for using the Altcoin Season Index: treat it as a confirmation tool, not a predictive one. It is a compass for the current market climate. Its purpose is to help verify an existing trend, not to forecast a future one.
A Tool for Strategic Allocation
Primarily, the index is used for strategic portfolio allocation. A high index reading (above 75) provides a data-driven basis for traders to consider increasing their exposure to a diversified selection of the best altcoins, as it suggests market momentum is favorable.
When the index begins to decline from a peak, however, it can serve as an early warning signal for taking profits. Smart traders use this signal to begin rotating capital out of their high-flying altcoin positions and back into the relative safety of Bitcoin or stablecoins to protect their gains.
Confirmation, Not a Standalone Signal
The index should never be used in isolation. Its signals become far more powerful when confirmed by other indicators, especially a falling Bitcoin Dominance chart. When the index is high and BTC.D is low, the case for an ongoing altcoin season is incredibly strong.
To improve timing, traders frequently combine the index’s signal with other standard technical tools. Using indicators like the RSI, moving averages, or trading volume can help confirm entry and exit points. This adds a layer of confidence to any altcoin trading decision.
Risks & Limitations of the Index
While the Altcoin Season Index is a useful indicator, a smart trader always understands the limitations of their instruments. To use the index effectively and manage risk, you must be aware of its blind spots. It provides context and confirmation, not guaranteed future results.
Here are the key limitations to keep in mind:
- It’s a Lagging Indicator. Because the index uses 90 days of past data, it acts as a confirmation of a trend already in motion. It does not predict the start of an altseason. By the time it signals 75, a significant portion of the initial gains might have already happened.
- It Has a “Top 50” Bias. The index is limited to the top 50 altcoins. It will therefore miss the initial, often explosive growth of newer, small-cap projects, which can be a key part of an altcoin trading season. A powerful new narrative can emerge while this index still appears dormant.
- It Ignores Macro and On-Chain Data. This is purely a price-performance tool. It is blind to major news, regulatory shifts, on-chain metrics, or social media sentiment. Any of these can drastically impact the market and invalidate the current price trend.
- It Can Give False Signals. Sometimes, a brief, sharp rally in just a few large-cap altcoins can push the index above 75. This can create a false positive that doesn’t develop into a sustained, broad altseason, which could be a trap for traders relying only on this signal.
Therefore, the index should always be used as one tool among many. It is most powerful when combined with an analysis of Bitcoin Dominance, trading volume, and the overall market structure.
Final Notes
The Altcoin Season Index is best understood as a simple barometer for market sentiment. When used alongside the Bitcoin Dominance chart, it provides a clear, data-driven view of whether capital is flowing towards the market leader or into the more speculative world of altcoins.
However, remember that the index is a tool for context, not a crystal ball that predicts the future. Its signals should confirm your own research, not replace it. The most successful traders will use it as one component in a disciplined altcoin trading strategy, never in isolation.


