Weighted Moving Average (WMA): What is it, and How to Use it in Crypto Trading
Everyone in trading who deals with charts and numbers has their own method and strategy. One way to predict the movements on these charts is moving averages. It is one of the most important technical analysis tools for examining price movements. The WMA is a type that gives significance to recent price data, which helps identify trends.
We will define WMA in this article, along with its application and function in analysis, trend direction determination, and the creation of well-informed trading methods.
Key Takeaways
- WMA provides a more responsive examination of trends by prioritizing recent price movements.
- Compared to other moving averages, it assists in trend identification faster, particularly in unpredictable markets.
- WMA improves trend detection and trading accuracy when used with other indicators like RSI or MACD.
What is the Weighted Moving Average?

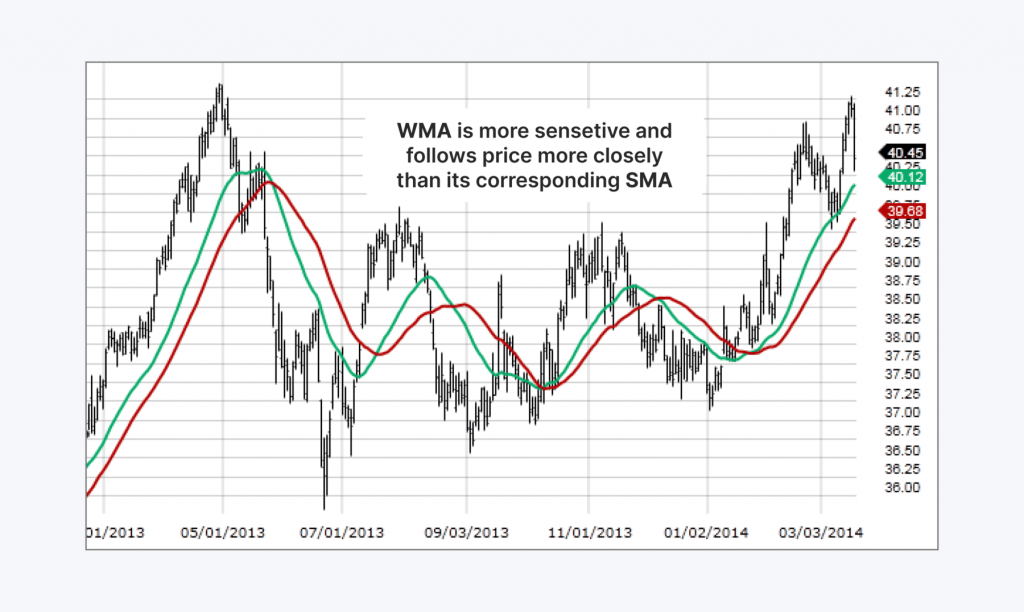
One basic tool for examining price movements in financial markets is the WMA. It provides more weight to recent data points than the simple moving average (SMA), which gives each data point the same weight. It is a useful tool for seeing patterns and making wise trading selections because of its weighting, which enables it to react to recent price moves more swiftly.
The weighted moving average gives every data point a matching weighting factor. Older data points are given lower weights, whereas recent prices are multiplied by greater factors. Compared to the SMA, which averages all data points equally, this method helps more accurately depict current market patterns.
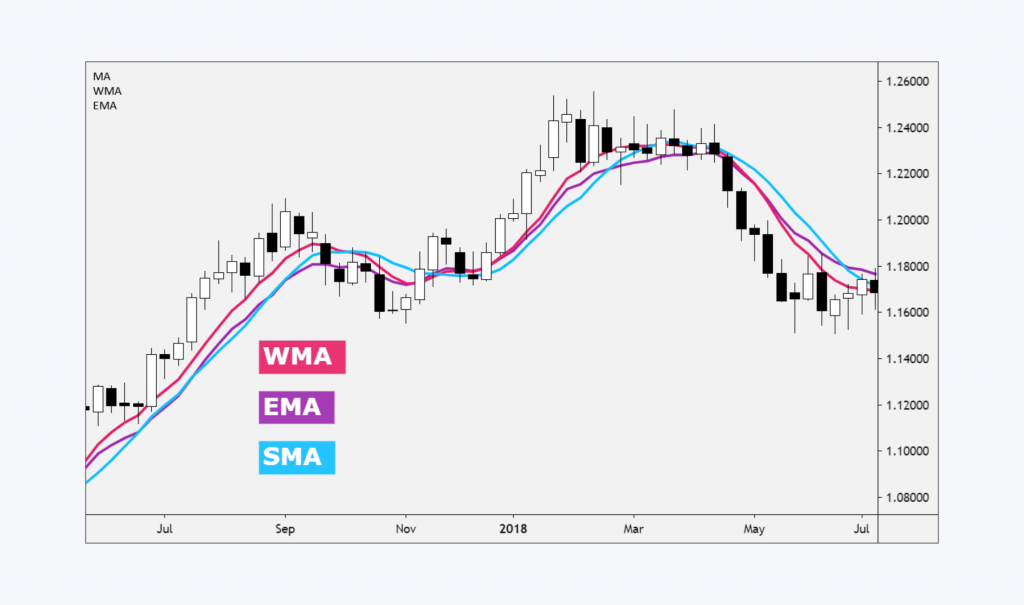
The WMA is even more sensitive to short-term price movements than the exponential moving average (EMA). Although recent data is given priority in both approaches, the EMA uses a smoothing constant, while the WMA’s calculation gives recent price data particular preset weights. Because of this distinction, the WMA is quite good at capturing transient price changes.
The WMA is especially helpful when traders must respond swiftly to price fluctuations or in volatile markets. It assists traders in identifying trend direction and modifying their strategies in response to current market conditions by giving greater weight to the most recent price data.
How WMA Works
Let’s say you are a trader and have been observing some cryptocurrency the previous week. Since recent prices are probably a better indicator of the current market trend, you should give them more weight than a SMA, just the average of the daily closing prices. This is how it works:
Let’s break down the prices of the coin:
Day 1: $30,000
Day 2: $27,000
Day 3: $25,000
In this case, an SMA would sum all the numbers up and divide it by 3.
(30,000 + 27,000 + 25,000) / 3 = $27,333.33
in the case of the weighted moving average:
We give recent prices larger weights to determine it. For the newest to the oldest day, let’s utilize weights of 3, 2, and 1 accordingly.
[(3 * 25,000) + (2 * 27,000) + (1 * 30,000)] / (3+2+1) = $28,166.67
It provides a higher value than the SMA, as you can see. This is because it emphasizes the recent price gains more, implying that the coin’s price may be on the rise.
WMA vs. Other Moving Averages

Let’s go into more detail and differentiate them:
WMA vs SMA
While the simple moving average gives each data point in the dataset equal weight, the weighted moving average gives more weight to recent price moves. It can react to recent price patterns and market swings faster because of this weighting component.
In reality, WMA helps spot transient shifts in price movement, whereas SMA’s lagging characteristic offers a more comprehensive picture of general patterns.
EMA vs. WMA
Recent data is given priority by both the exponential and weighted moving averages. But the manner of calculating is different. The weighting factor used by the WMA is linear, meaning that for older data points, the weight gradually drops.
The EMA progressively lessens the influence of older prices by using an exponential calculation. It works well in volatile markets since it is typically more responsive to abrupt changes in the market.
The linear weighting method of the WMA offers greater stability in trend analysis by responding to recent price swings in a balanced manner.
When Should You Favour WMA
In trending markets, it is frequently chosen when obtaining up-to-date price information, which is essential for making wise trading decisions. It works especially well when an exact determination of entry and exit sites or support and resistance levels is necessary.
It is less sensitive to false signals than the EMA. It helps in trend identification more quickly than the SMA for short-term trading tactics like scalping and day trading.
Fast Fact
Technical analysis was made practical by Charles Dow, who created The Wall Street Journal and the Dow Jones Industrial Index.
How to Calculate Weighted Moving Average

The WMA gives each point in a data set a certain weighting factor. Compared to other ones, the WMA is more sensitive to the state of the market because recent price moves are given greater weight.
Older data points are given less weight, which lessens their impact on the determined average price. Because of its sensitivity, it may react swiftly to shifts in market movements.
Each data point is multiplied by the appropriate weighting factor in the Weighted moving average formula to determine the average. After that, the sum of these products is divided by the sum of the weighting factors.
Take a 4-day WMA, for instance, with closing prices of $10, $12, $14, and $16:
Assign the corresponding days weights of 1, 2, 3, and 4.
- The closing prices are multiplied by the weights. $16 × 4 = $64, $14 × 3 = $42, and $10 × 1 = $10.
- The weighted values add up to $140 ($10 + $24 + $42 + $64).
- Subtract from the total weights (1 + 2 + 3 + 4 = 10): $140 ÷ 10 = $14.
The calculated number is $14, illustrating the influence of current price fluctuations more than older data points.
Because of its adaptability, it can be used with hourly, daily, or weekly data. It records quick swings in shorter periods, which helps spot more general market patterns in longer ones. Because of its adaptability, traders can use the WMA to implement various trading methods.
Tips for Trading with WMA
To successfully implement it into crypto trading, it is essential to know the fundamentals:
Selection of the WMA Period
A shorter period (5–10 days) may help spot short-term trends and possible entry/exit points in volatile markets.
In less volatile markets, a longer period (such as 50–200 days) can aid in spotting more significant trends and offer a smoother signal.
In Conjunction With Additional Indicators
MACD and WMA:
- Purchase Signal: A bullish crossover may be indicated when the shorter-term crosses above the longer-term WMA. An additional indication of this is a bullish MACD crossover.
- Sell Indication: On the other hand, a bearish MACD crossover can validate a bearish crossover.
Relative Strength Index (RSI) and WMA
Overbought/Oversold Indications An overbought situation is indicated when the RSI exceeds 70. A bearish crossover may indicate a possible downward correction.
An oversold situation is indicated when the RSI falls below thirty. A bullish crossover of the WMA may indicate a possible upward trend.
Bollinger and WMA Bands
The breakouts A significant bullish trend may be indicated when the price breaks above the upper Bollinger Band. A bullish crossover can verify this.
A significant bearish trend may be indicated if the price drops below the lower Bollinger Band. It can confirm this with a bearish crossover.
Some More Tips
Evaluate a WMA strategy’s performance and optimize its parameters by backtesting it on historical data before implementation. To reduce risks, always utilize stop-loss orders. To ensure profits, think about utilizing take-profit orders.
The state of the market can shift quickly. Be ready to modify your strategy and settings as necessary. Also, avoid taking on too much at once. Spread your investments over a variety of cryptocurrencies and trading approaches.
Keep in mind that you should refrain from acting rashly in response to transient price swings. Remain disciplined and stick to your plan.
Final Thoughts
When examining market trends, WMA is a helpful tool. Using recent data point and price shifts to discover patterns is useful. Integrating it into successful trading methods requires understanding its pros and cons. Your decision-making can be improved by providing a clearer perspective of pricing movements.


