XRP Price Analysis: Will Ripple Reach $2 in 2024?
The crypto market is buzzing with the US election news. After voting for the pro-crypto Donald Trump, the blockchain space is optimistic about upcoming reforms and policies that could boost the DeFi world.
After the surging Bitcoin price, Ripple is experiencing a time of its life, with skyrocketing market capitalization and new price levels. Speculators are eyeing a new XRP price target, and traders are waiting for the coin to return to the top five list.
Let’s explore the potential of Ripple with XRP price analysis and trend prediction.
XRP Coin Performance
After ranging between $0.50 and $0.60 for the majority of 2024, XRP makes a significant breakthrough in November. Ripple rose by 27% in the second week of November from $0.55 to $0.70.
The bullish movement continued as XRP hit the $1 level on 16 November for the first time in three years since November 2021.
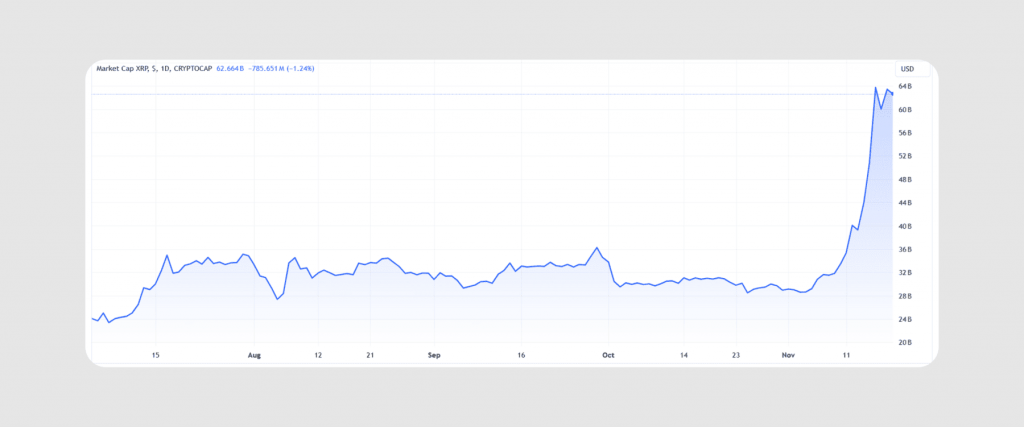
At the same time, the market cap and trading volume were at their peak performances. The capitalization grew significantly between 10-16 November, almost doubling from $33 billion to $63 billion in five days. By that, XRP overtook DOGE and ranked #6 in the top cryptocurrencies.

Why is Ripple Going up?
The ongoing XRP bullish performance is attributed to various factors.
The election of a pro-BTC US president suggests more crypto-friendly policies will be introduced, including new regulatory reforms and faster introduction of XRP ETFs.
Ripple Lab is achieving progress in its battle against the SEC, coming at the back of the scrutiny against the US regulator as 18 states sue the SEC for its unjustified power overreach and unfair treatment.
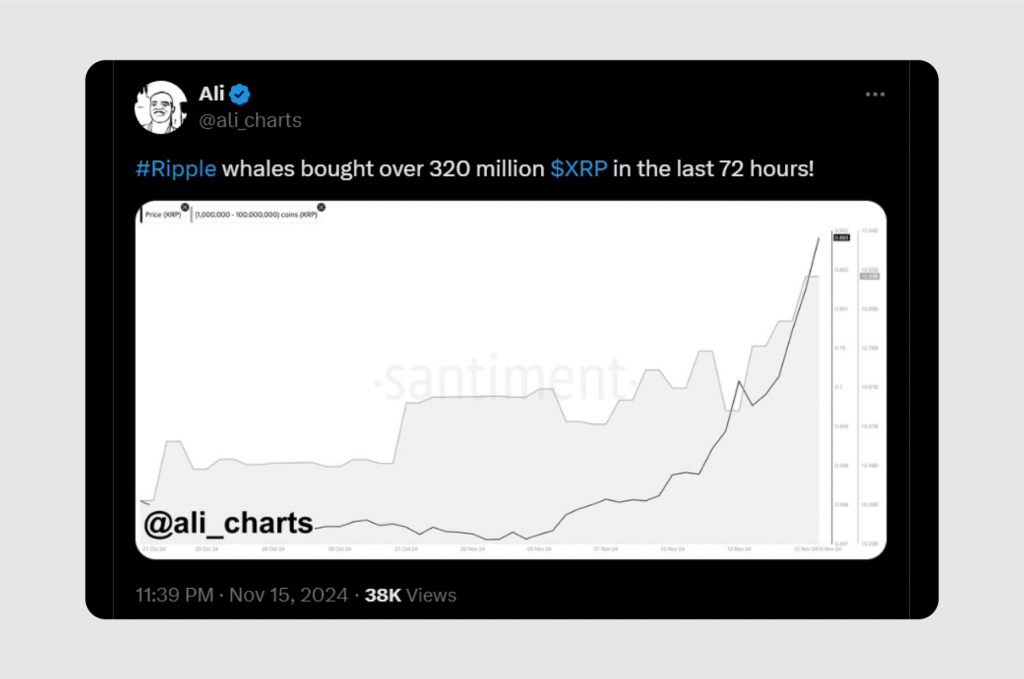
The increasing trading activity has also contributed largely to this surge. Robinhood, a US-based trading platform, has listed XRP on its trading desk, driving more trading demand by US users. At the same time, a significant whale activity saw the acquisition of 320 million XRP, triggering a massive interest.

XRP Price Analysis
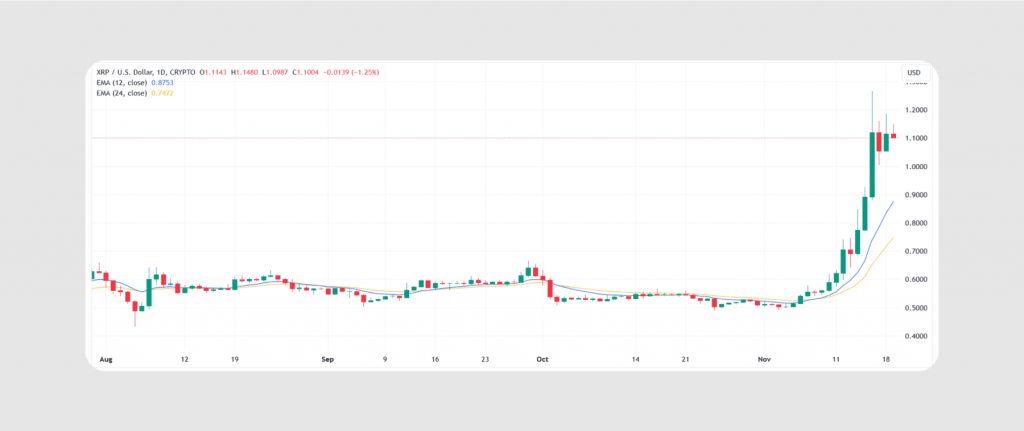
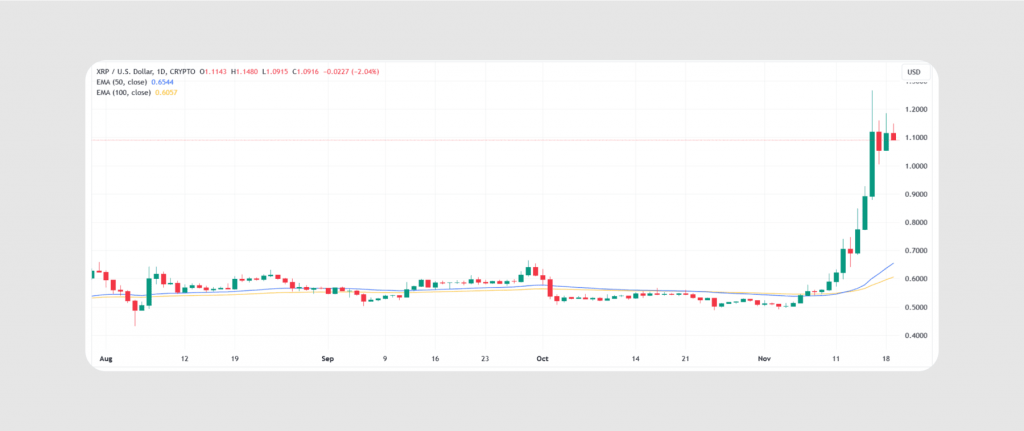
Let’s look at the XRP price chart and analyze it using the exponential moving average indicator (EMA). We use EMA over different timelines to measure the short-term and long-term changes and possible trends.
For short-term analysis, we use the 12-day and 24-day EMA lines. We see that after moving closely above and below the price line, the XRP price breaks through well above both EMA lines.
On 7 November, the XRP market price climbs over the EMA indicators and pushes away from both lines, reaching $1 and continuing to $1.09, as of writing.
The upward-looking EMA lines under the market price suggest a bullish movement in the next few days.

If we extend the historical data to 50 and 100 days, we see a similar trend with a more relaxed slope. Both EMA lines are heading upward, suggesting a bullish trend.
However, the easy slope suggests that the XRP price can potentially increase sharply in the next few days but will most probably correct itself while remaining above its historical average.

XRP Price Prediction
The coin reached $1.00 after three years, which is itself a significant achievement and indicator of the future of this crypto, which was once in the top three.
Analysts suggest that ongoing patterns and performances are similar to those of 2018 when the XRP market price reached its all-time high of $3.00.
Bulls are also reminiscing about the 2021 run that took the coin up to $2.00 and hoping for a similar rally to push the coin to the $2 mark before the end of this year.
Conclusion
Following the hype in the crypto market, Ripple is experiencing an exceptional performance marked by milestone price levels and a surging market cap.
The XRP price analysis suggests that this ongoing bull run can last for a few days while speculators are pushing for a $2 support level before the year ends.
Disclaimer: This article is for informational purposes only. It is not finance advice and should not be relied upon for investment decisions. Always do your own research and consult a financial advisor before investing.


