
Bitcoin’s Price Action Signals Sideways Movement Despite Breaking Technical Indicator.
Bitcoin’s price slipped below the lower range of its Bollinger bands, a notable technical indicator, just ahead of the federal reserve’s two-day monetary policy meeting.
While the timing of these events might be seen as coincidental, some traders are eyeing the potential retracement towards its 20-day moving average. The situation has garnered attention, and whether there is any deeper connection between the two events remains speculative.
Quick Fact: The United States Federal Reserve is expected to boost interest rates by 25 basis points (bps) today.
What comes to performance of the coin itself, Bitcoin has been displaying a remarkable lack of responsiveness to macroeconomic developments, which hasn’t gone unnoticed by crypto market followers. Even with two recent rate hikes in May and March, the price movements for BTC were relatively subdued at 1.13% and -2.87%, respectively. Similarly, in response to inflation and GDP data, BTC showed minimal reactions of just -0.74% and 1.16% after each event.
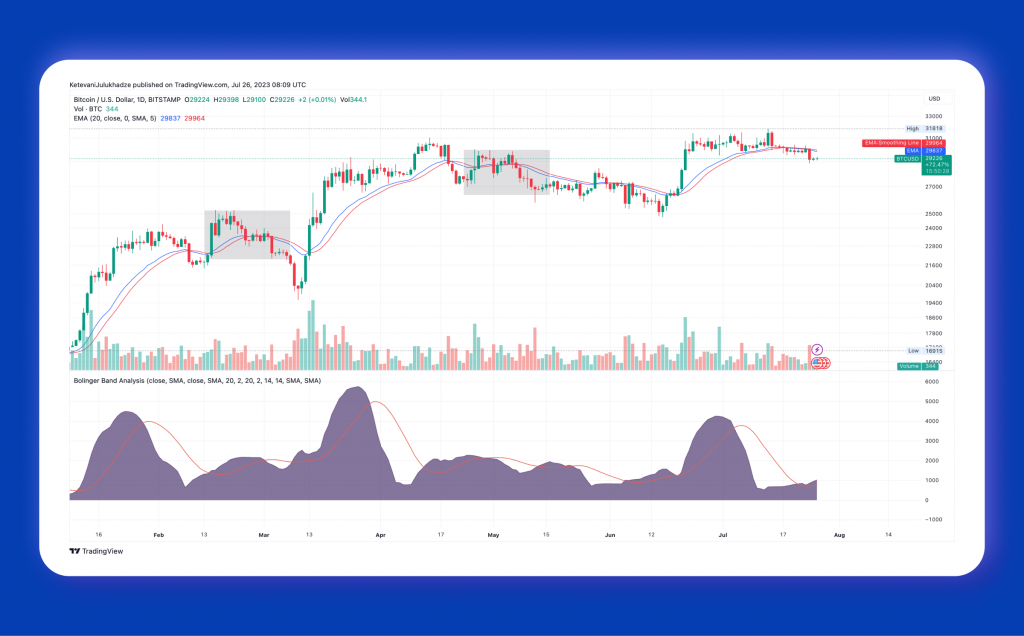
Given this behaviour, the crypto markets have already considered the anticipated move. However, what catches traders’ attention is BTC’s recent dip below the lower range of its Bollinger Bands. This indicates that the price might increase, although the expected movement is likely modest.
Bollinger Bands, a widely used technical indicator, track an asset’s 20-day moving average and plot price levels two standard deviations above and below the average.
As an asset’s price is expected to stay within two standard deviations of its average 95% of the time, a breach of the external bands is seen as statistically significant.
Traders have set their sights on a potential upside target of $30,000 for BTC, aligning with the cryptocurrency’s 20-day moving average. This level holds significance as it coincides with a high volume area of activity, suggesting a strong consensus among market participants.
However, it’s worth noting that BTC’s recent decrease in volatility and narrowing trading range leaves only a narrow 3% upside between its current price and the 20-day average. While this indicates a possible slight increase in BTC’s value, it also implies that the cryptocurrency might encounter resistance once it advances to this level.
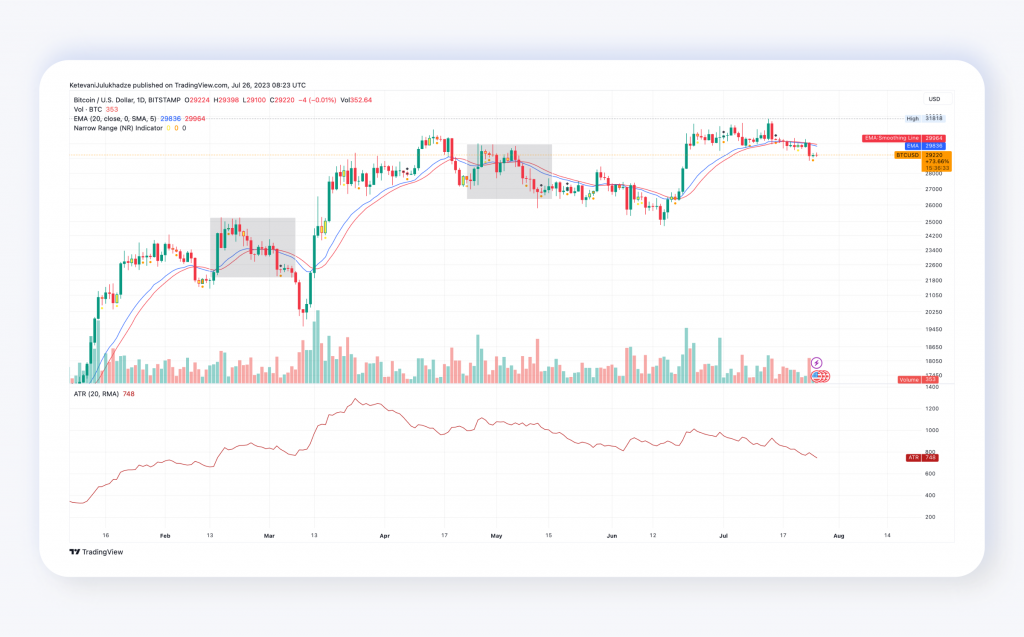
The spread between BTC’s current prices and its 20-day average is approximately $900, which lies beyond the cryptocurrency’s current average true range (ATR) of $748. This suggests that even a mild 3% price increase to reach the 20-day average could mildly elevated Bitcoin’s volatility in the market. Traders are closely monitoring these indicators to gauge potential market movements shortly.
Additionally
The current trend of holding onto Bitcoin instead of trading it may indicate a lack of trust in centralised exchanges. However, large and small investors have shown consistent confidence in the cryptocurrency, as demonstrated by stable Bitcoin wallet balances.
Additionally, cryptocurrency stability is influenced by global market conditions, political and geopolitical situations, and economic fluctuations that greatly impact the crypto industry. For instance, the recent signing of a bill by President Vladimir Putin to introduce the digital ruble in Russia will have significant implications for the crypto market. This new law legalises and regulates the use of the Bank of Russia’s digital currency for payments and other transactions, with implementation starting on August 1. As a result, we can expect significant changes in the crypto market shortly.


