
Critical Crossroads for ETH Price: Potential Major Correction Reaches As $1620 Support Faces Buyer Pressure.
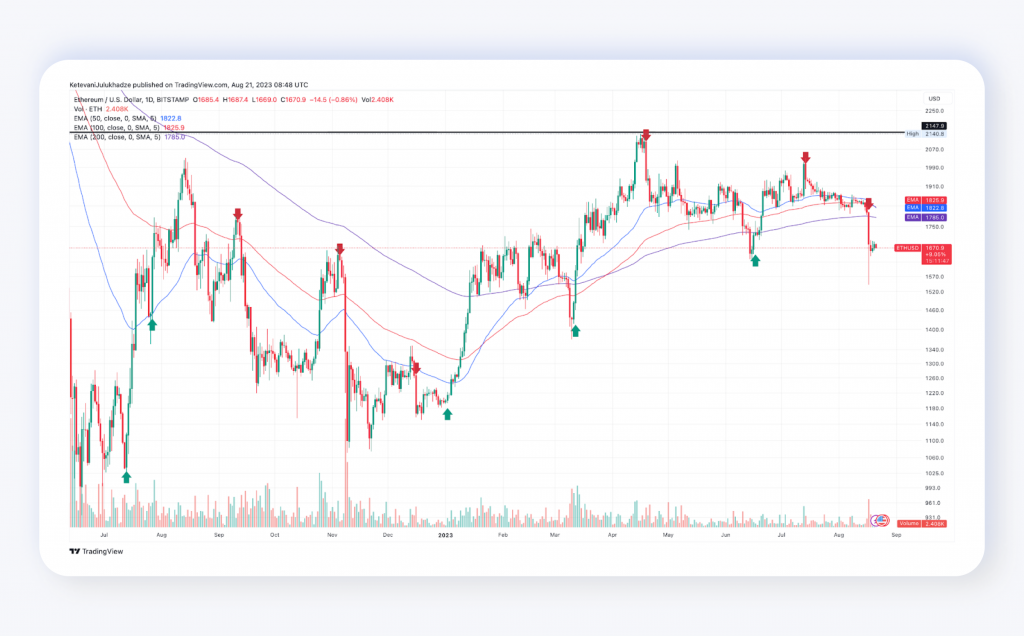
The Ethereum coin has entered a correction phase after encountering resistance at the $2020 level. Over the past five weeks, the price has fallen by 17.5% and is currently trading at $1669. This decline has also led to a breakdown of the support trendline in the channel pattern, suggesting that the second largest cryptocurrency may experience additional correction in the near future.
Essential Points From Ethereum’s Daily Chart
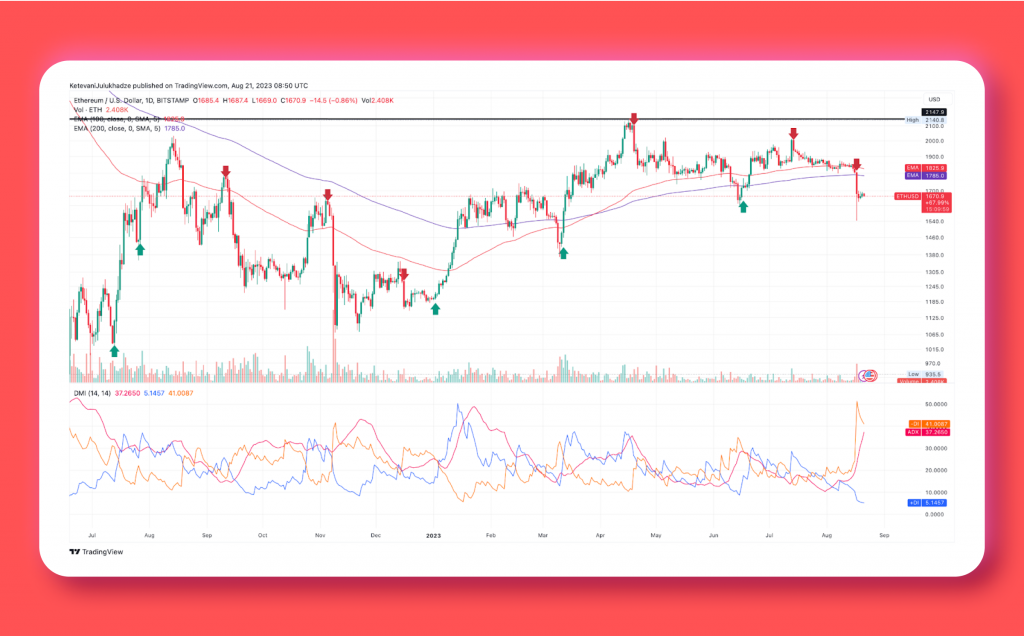
A breach below the $1620 level would defy the principles of the Dow Theory, signalling a disruption in the ongoing uptrend and potentially fueling further selling pressure. Notably, the substantial gap between the upward slope of DI+ and the downward slope of DI- in the directional moving average underscores the prevailing bearish momentum.
With the current Ether intraday trading volume at $4.6 billion, indicative of a 20% loss, the market landscape is laden with caution. This comes as Ethereum’s price, as of the time of this writing, stands at $1671, showcasing a promising uptick of its own by the day’s progression.
An intriguing development occurred on August 17th when Ethereum’s value underwent a significant breakdown, shattering the confines of a longstanding rising channel pattern. This chart arrangement had sustained a commendable upward trajectory spanning nearly nine months, effectively presenting multiple opportunities for accumulation during intermittent dips.
However, the implications of this breakdown could potentially flip market sentiment, fostering a sell-on-bounce atmosphere that tempts short-selling endeavours. As of the present moment, Ethereum’s price registers at $1671, reflecting a modest intraday gain of 0.13%.
Historically, major declines are frequently followed by minor corrective rebounds, aimed at rekindling bullish momentum. Yet, the current sideways trading pattern of the coin’s price serves as a tangible testament to the ongoing potency of selling pressure, indicating a persistent bearish bias that might well propel the price to plummet below the $1620 threshold.
Anticipating the aftermath of this post-breakdown descent, the altcoin could be poised to descend further to $1495, and potentially even push down to $1370.
Can ETH Price Overcome Obstacles and Rise Again?
In the present scenario, as Ethereum’s price holds steady at $1671 with a growing trend, a potential rebound from the critical $1620 support level could mark a pivotal turn. Such a resurgence might propel the price trend upwards by approximately 7%, aiming to retest the trendline that had been breached earlier. However, should the coin’s value remain below this recently converted support, the risk of a prolonged correction may continue to loom over coin holders.
To effectively counteract the ramifications of this breakdown and initiate a fresh phase of recovery, it becomes imperative for the coin’s price to achieve a closing figure surpassing the peak observed on August 17th, which was $1808.
Drawing insights from technical indicators:
- Exponential Moving Average (EMA): A potential bearish crossover between the 20-day and 200-day EMAs could potentially amplify selling pressures within the market.
- Average Directional Index (ADX): The ADX slope currently stands at 31%, indicating that the downward trend is inching closer to a point of maturity.
In conclusion, with Ethereum’s current price at $1671 and on an ascending trajectory, the crucial crossroads at the $1620 support level might dictate the future course. A successful rebound could usher in a 7% surge and a retest of the breached trendline. Conversely, maintaining a position below this support level could prolong the correction phase. The path to recovery hinges on breaching the August 17th high of $1808, while a bearish EMA crossover and ADX trend maturity warrant close monitoring for market dynamics.


