ETH Prices Shoot Up After Ethereum ETF Approval – What Now?
After the recent crypto market rush following the Bitcoin ETF approval, the Ethereum network is experiencing a similar surge in transactions and volume after the SEC’s decision.
In what investors described as “a welcoming surprise,” the US Securities and Exchange Commission announced Ethereum ETF approval after leading investment firms and institutions submitted their applications for listing spot Ethereum ETFs.
The outcome of this decision saw bulls take over the market, sending the ETH price higher, nearing its recent record of exceeding $4,000 in March 2024. Let’s review this decision and analyze the Ethereum price in detail.
Ethereum ETF Approval
On May 23, the SEC approved requests from the Chicago Board Options Exchange, New York Stock Exchange, and NASDAQ to legalize Ethereum ETPs and ETFs and offer them as trading options.
The decision was relatively quick compared to the previous Bitcoin ETF approval, which took months before the final decision. Many investors did not expect the decision to come through, given the regulator’s hostile attitude towards crypto assets and exchanges.
The actual listing will start a few weeks later after the SEC approves Ethereum ETFs’ individual listing cases for each applicant individually. It is still unknown how long stage two will take, but having an initial acceptance raises hope among investors and exchange platforms.
Increased ETH-based Activity
The ETH ETF approval pushed investors’ and traders’ confidence high and Ethereum prices higher. The blockchain network experienced a surge in activity and token operations.
The number of active wallets jumped by 3.5%, and ETH transactions increased by over 70%. The coin price is on an upward rally from $3,000 to over $3,900 in one week as traders and market bulls try to capitalize on the growing opportunities to make income.
Speculators compared this increased activity to the impact of spot Bitcoin ETF approval, which carried the whole crypto market to new highs when Bitcoin reached an all-time record of $70,000 and Ethereum just scraped the surface of $4,000.
Ethereum Price Today
Let’s analyze the ETH price in the short and long term to make speculative predictions of the Ethereum ETF approval outcomes.
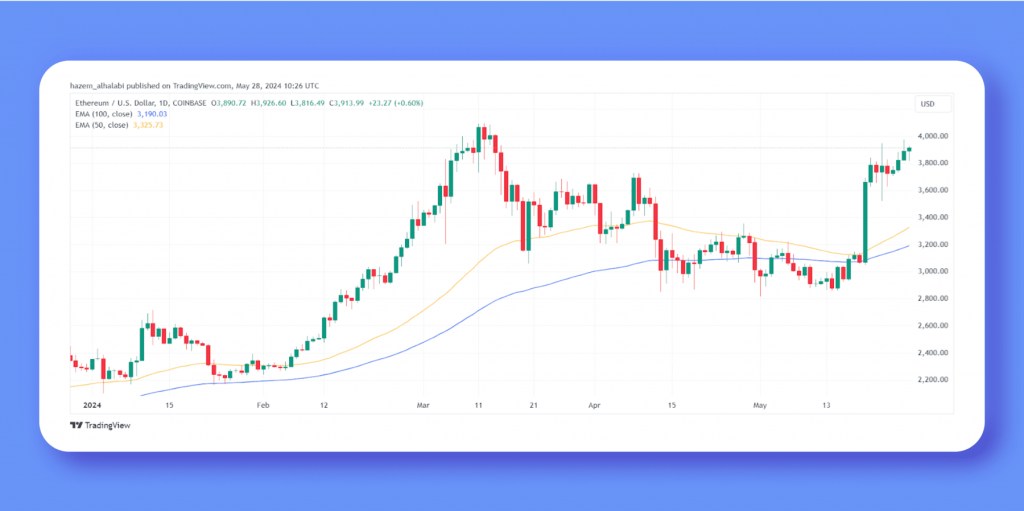
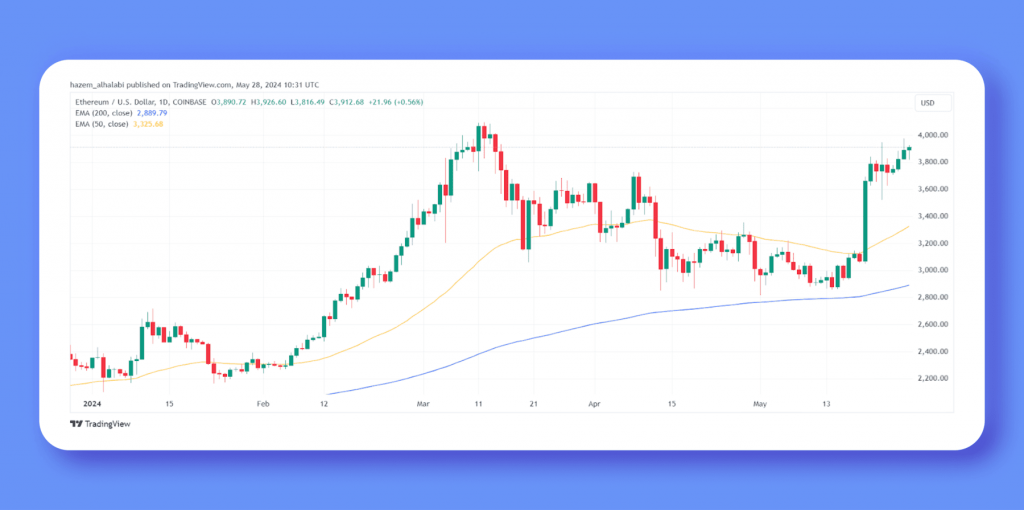
To do so, we use the exponential moving average indicator in different time lapses to measure the price changes.
We start by comparing the 50-day and 100-day EMA indicators in the graph below. We see that the yellow line has been moving above the blue one since the beginning of the year, suggesting that the market price has been driving above its average movements.
Both lines closed up a few days before 20 March. However, on 20 March, the ETH price surged significantly, closing at 19% higher than its opening price.
The increasing trend continues until the day of writing, with a slight upward shift from the blue line, suggesting a strong price surge.

We then use the 200-day EMA line with the 50-day indicator to track the price impact in the long term. We see a big divergence between both lines, indicating that the current market price is moving far away from its average and suggesting a long-term price increase that might go beyond its $4,000 threshold.

Final Remarks
The latest Ethereum ETF approval spurred higher trading activity and token transactions. This decision caused the market prices to surge, as the ETH coin price jumped over $900 in seven days.
The spot ETH ETF listing motivates traditional investors to combine crypto assets in their portfolios, which will eventually increase the demand for cryptocurrencies and contribute to overall market growth.
Disclaimer: This article is for informational purposes only and should not be construed as financial advice. Investing in cryptocurrencies, including meme coins, carries ingrained risks, and individuals should conduct their own research before making any investment decisions.


