
FTX Price History and Prediction: Can it Recover?
FTX made the headlines in 2022 amidst the infamous crypto winter that saw most cryptocurrencies underperforming and crypto investors pausing their investments in decentralised finance and exchanges.
After being named one of the largest crypto exchanges with millions of users and transaction volume exceeding $1 billion, the platform filed for bankruptcy in November 2022 due to mismanagement of assets.
FTX price history witnessed a massive drop in 8-Nov by 75%. However, FTX’s native token, FTT, started 2023 with an optimistic trend, and many started speculating on a token return. Will FTT recover and make a comeback? We will try to answer this question in the following analysis.
Discussing FTX
FTX, standing for “Futures Exchange”, is a crypto exchange platform established in 2019 that trades derivatives and crypto futures contracts. The exchange includes some of the market’s elite traders who launched their own decentralised platform.
FTX was distinguished for its broad crypto trading tools, including clawback prevention, robust stablecoin settlement management and centralised collaterals.
The exchange was backed by the market’s best trading firms, including BlackRock, Coinbase Ventures and Almeda Research, while the latter was associated with many of FTX’s mismanagement.
A series of asset mismanagement practices led to FTX’s liquidation, including significant withdrawals, unorganised customer funds and tight liquidity rates.
FTX 2.0
FTX News circulated in all news outlets and around the crypto market as more investors pulled out, fearing an unprecedented meltdown. However, the news resurfaced again in May 2023 around the attempts to resuscitate FTX, including 75 bidders.
An FTX 2.0 coalition was created to seek a way to relaunch the platform, with increasing market competition as the main driver for the recovery attempts. However, bidders are still hesitant if this move worthes in the long term.
Policymakers working on the bankruptcy file suggest that a recovery plan must target returning 90% of the clients’ lost assets. However, there is no way to guarantee reimbursement of victims because there are several legal and financial considerations that must be resolved.
However, recovery plans suggest that token distribution and lock-up must be prioritised over increasing FTX holdings in cash.
FTX Price History
FTX recovery news sent FTT price soaring in 2023 with multiple fluctuations that may restore confidence in FTX 2.0. We track FTT Coinmarketcap price action and analyse it with the exponential moving average in different timelines to explore if any potential trends are closing in.
FTT started 2023 with a positive trend as its price increased from $0.85 to $2 in 15 days, crossing 135% growth. Later, in April, the price trend witnessed another surge, driving FTT from $1.3 to $2.45, or a 78% increase in one day.
Another price jump took place in June when the price grew by more than 50% in a couple of days, reaching $2.1 in the summer of 2023.
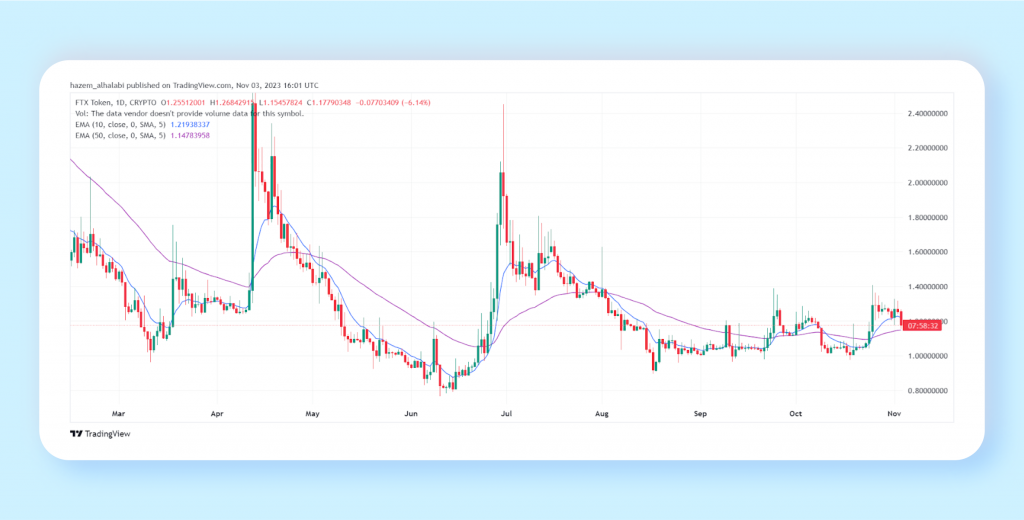
Looking at the 10-day EMA line, we see an upward trend with every price increase. However, by the beginning of November and close to the FTX trial date, the 10-day line moved north and crossed the 50-day line, picking up the price to new levels between $1.20 and $1.40
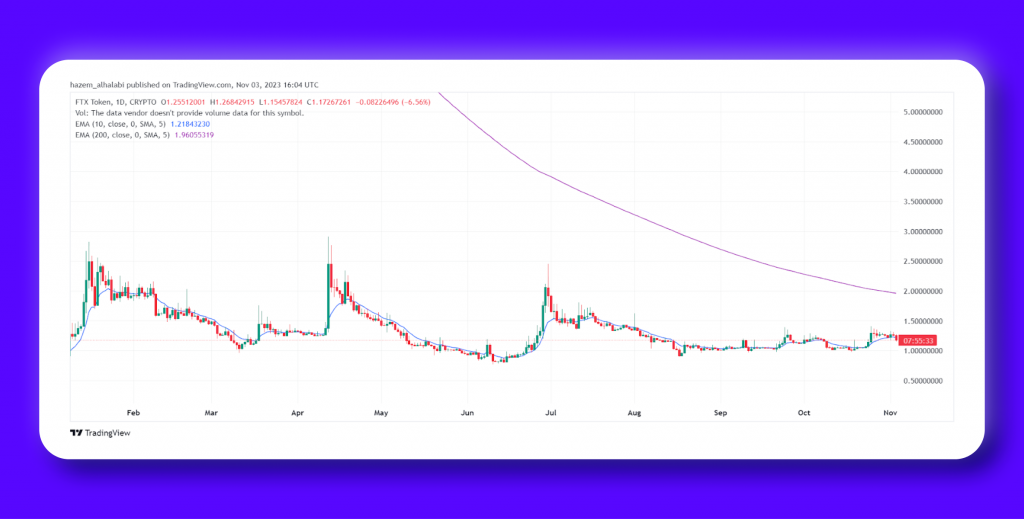
The 200-day EMA line has been moving far and above the 10-day line throughout the whole year. However, the two lines started to close up in November, hinting at a possible long-term upward trend.
The last time the 10-day EMA moved up and towards the 200-day line was in August 2022, when FTT reached record prices. Will we see a new price outbreak for FTX’s token towards the end of the year? Only time will tell.
Is FTX a Good Investment?
For the longest time and since the FTX collapse, investing in this crypto exchange was not the best advice. However, recent developments in FTX price history and recovery plans might breathe life into the FTT price.
The strong movement of the 10-day line up and towards the 200-EMA line is an indicator that prices might increase and catch a bullish sentiment for the long term. It is a weak indicator but still a hope for a reborn FTX 2.0.


