
What Is a Pin Bar Strategy And How to Master It
Candlestick patterns such as the pin bar hold significance for traders. They demonstrate traders’ sentiment towards the market and can assist in determining the appropriate timing for purchasing and selling.
Utilising these patterns, along with other tools, can assist traders in forecasting future price fluctuations and potentially increasing their profits. This is why analysts heavily rely on them when making trading decisions.
In this article, we will discuss some of the pin bar trading strategies, guide you on how to master them and review their benefits and limitations.
Key Takeaways:
- A pin bar is a candlestick arrangement used in trading.
- Pin bars can be bullish or bearish.
- Hammer, inverted hammer, shooting star, and hanging man are pin bar types.
Defining Pin Bars
A pin bar is a candlestick arrangement used in finance trading. It offers valuable market analysis and signals potential shifts in price movement.
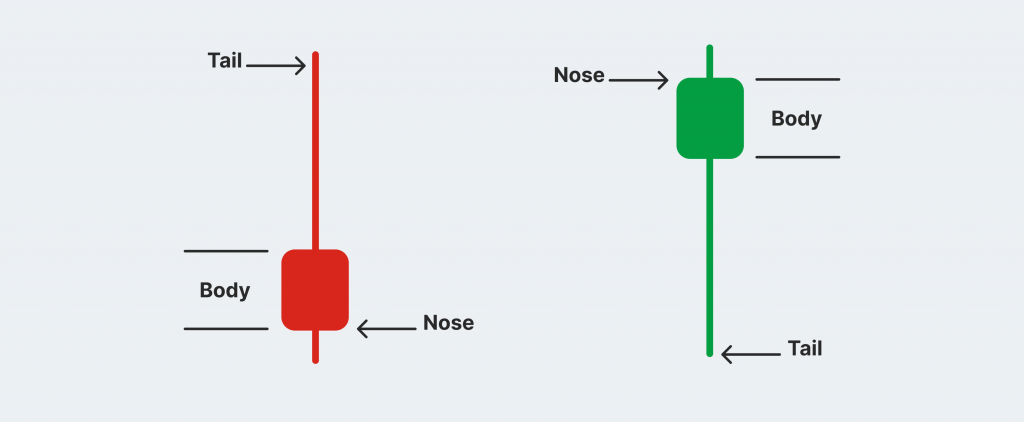
A pin bar candlestick consists of three key components:
- The nose. It occupies a small part in the middle, showing a low price range.
- The tail. This is a small line at the top or bottom of a price chart that shows when the price was rejected.
- The body. It shows the opening and closing prices using different colours for when the market goes up or down.
When the long tail is below the price following a downward trend, it suggests the possibility of an upward price movement. An uptrend followed by a long tail above the price may indicate a possible price decrease. Pin bars, observed on financial charts, help traders determine the right time to buy or sell in financial markets.
Pin bars are important for figuring out when the market might change direction. When bearish bars appear, it indicates that the market could be moving from an upward phase to a downward phase, whereas bullish bars indicate the potential rise in the market after a downtrend. The bars assist traders in determining when the market may shift in direction.
Bullish Pin Bar
The formation of a bullish pin bar candlestick design signals a potential turnaround in the market from a downtrend to an uptrend. This points out that buyers are once again dominating and driving up the price. Traders interpret this as a sign of a potential market rally and potential price hikes. The indicator shows more strength when the tail or wick breaks the price level.
It is a pattern with a tiny body, a long lower shadow, and a small or absent upper wick.
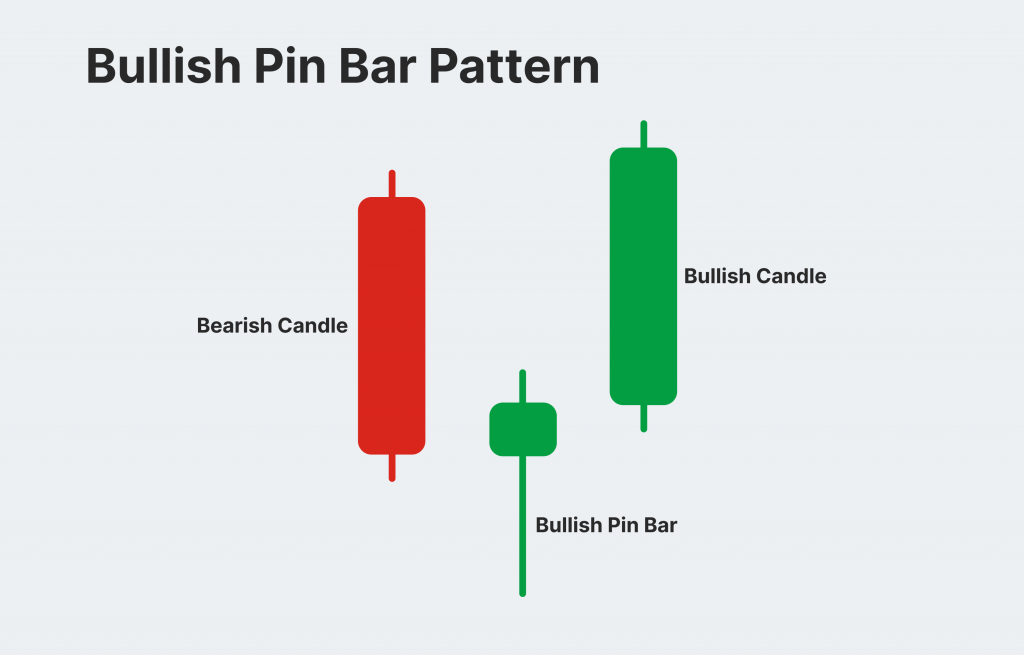
The long lower shadow indicates a significant price drop during the trading period, but the price was rejected and pushed back up, suggesting a shift in market sentiment and potential buyer entry.
To be valid in a bullish pinbar pattern, it must have a downtrend foregoing it with higher and lower lows. For reversal signals, the preceding trend can be either up or down. The previous and subsequent candlesticks should not touch the low price of the pin bar candle, which is not commonly used but is recommended to avoid false signals.
Bearish Pin Bar
A bearish pin bar is characterised by a long upper shadow and a short or nonexistent lower shadow. The bearish pin bars pattern suggests a potential declining trajectory in the market.
The extended upper shadow indicates a significant initial price increase followed by selling, suggesting a potential slowdown in the market. Once validated, investors seek opportunities to sell stocks at a high value and repurchase them at a lower price in order to profit from a declining market.
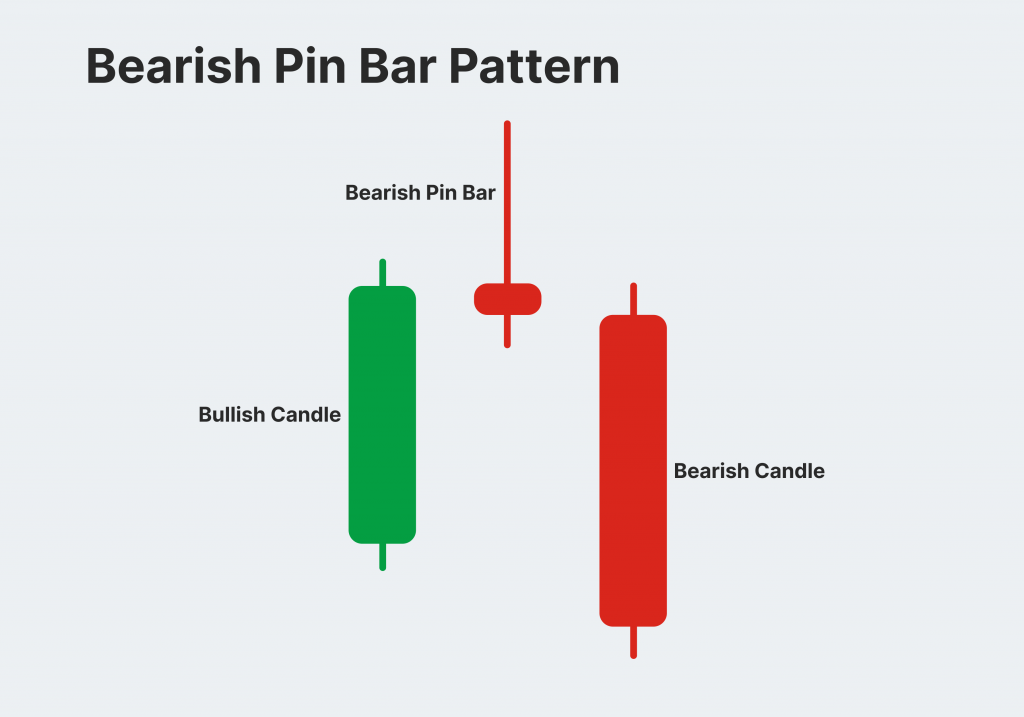
To confirm the validity of a bear pin bar pattern, analyse whether the preceding trend showed an upward trajectory and if the trend before that was uncertain. The bearish pin bar candlestick price should be lower than the candles preceding and following it.
Traders view this as a bearish signal, suggesting a potential decrease in price and gaining strength from sellers.
Pin Bar Types
The pin bar family consists of four types, each with unique signals and characteristics that can help traders make wise decisions.
Hammer
With a short upper body and a long lower wick, this bullish pin bar indicates the potential for a downtrend to turn into an uptrend.
The long lower wick indicates a short period of sellers’ control, followed by buyers’ outmatch, indicating a strong bullish signal and a buying opportunity.
Shooting Star
This is a candlestick pattern indicating a significant increase in stock price pursued by a sudden decrease, which hints at a reversal in the trend.
The long upper candlewick signifies that buyers temporarily pushed prices to a new high, only for sellers to take over and push them back down.
Inverted Hammer
The pattern displays an extended wick pointing upwards, resembling a shooting star. It becomes visible after a decrease in price, indicating the potential for an increase.
It suggests that prices have attempted to rally but lack strength and have been pushed back down by sellers, with the wick not protruding above the previous candle.
Hanging Man
This candlestick shape is similar to a bearish pin bar and is comparable to a hammer pattern. It emerges following an upward trend, often close to a resistance point, and indicates a shift in market climate from favourable to pessimistic. The hammer pattern typically occurs succeeding a decline in price, often in the vicinity of a support level.
How to Trade Using Pin Bar Candlesticks
Pin bar signals can be found in any tradable market, including crypto, forex, stocks, indices, and commodities.
When trading candlestick arrangements, particularly pin bars, it’s crucial to be cautious of false signals. Pin bar patterns are reliable in predicting price reversals, but it’s essential to avoid following the wrong pattern. To avoid unnecessary losses, traders should wait for confirmation before trading every pin bar on a chart.
The dimensions of the upper and lower wick of a bear and bull pinbar candle can indicate crucial information about the strength and significance of price movement in either direction. Longer shadows generally indicate a stronger sentiment towards the market’s fluctuations.
Let’s look at the illustration of a pin bar trading method.
The bull pin bar strategy involves the following steps:
1. Identify candles near support levels.
2. Place a buy-stop order at the top
3. Placing a stop loss on the opposite side.
4. Set an initial target at 2x the risk taken and not exceeding 1.5% in one trade.
The bear pin bar suggests a strategy that involves the following steps:
1. Identify bear pin bar candles near resistance levels.
2. Place a sell-stop order at the bottom.
3. Place a stop loss on the opposite side.
4. Set an initial target at 2x risk and not risk more than 1.5% in a single trade.
Pin bars can be traded using various entry options, including entering the trade “at market” at the current market price, waiting for the pin bar pattern to close out, entering on a 50% retrace of the pin bar, or using an “on-stop” entry placed just below the low or above the high of the pin bar. The pin bar pattern must be closed out before entering the market based on it. Until the bar is closed as a pin bar model, it is not considered a pin bar yet.
Pin Bar and Inside Bar Patterns
Pin bar and inside bar combo patterns are two types of price action strategies. Pin bars indicate rejection of price and probable reversal, while inside bars indicate consolidation and potential breakout.
When the signals are put together, they make a pattern called a “pin bar combo” or an “inside bar – pin bar combo. ” The pin bar combo pattern is formed by a pin bar followed by a small inside bar close to the pin’s nose. The inside bar + pin bar combo pattern occurs when a pin bar is located within the high and low range of a larger outside bar.
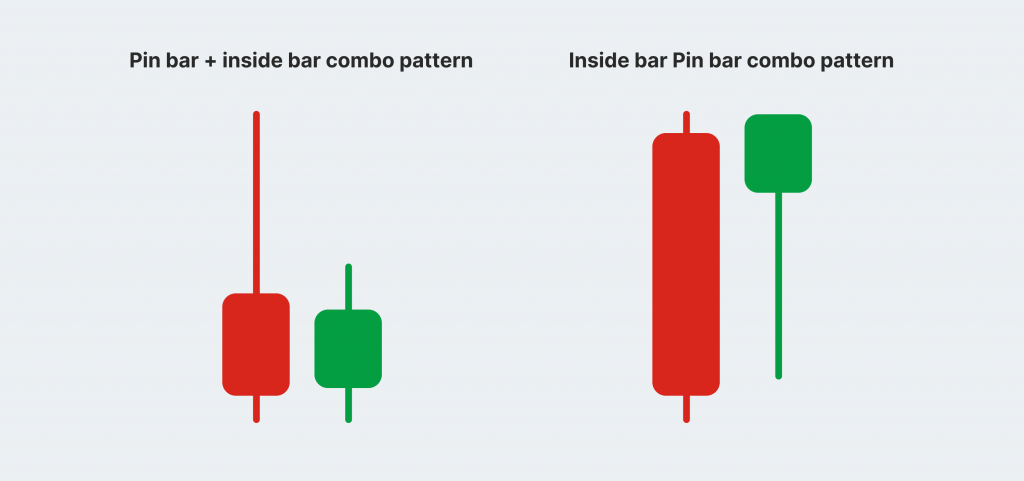
Pin bar and inside bar patterns are formed when a pin bar is followed by an inside bar within its high-to-low range. The pin bar + inside bar combo is the most powerful setup for trading on daily charts, either from pullbacks to key levels or as breakout plays in trending markets.
Benefits and Drawbacks
The pin bar setup is a widely recognised trading scheme that offers clear reversal signals, particularly near influential support or resistance levels. It is particularly effective near these areas, which increases the probability of trend reversals.
Pin bars are visible on any liquid capital market and time frame, making them prevalent among traders.
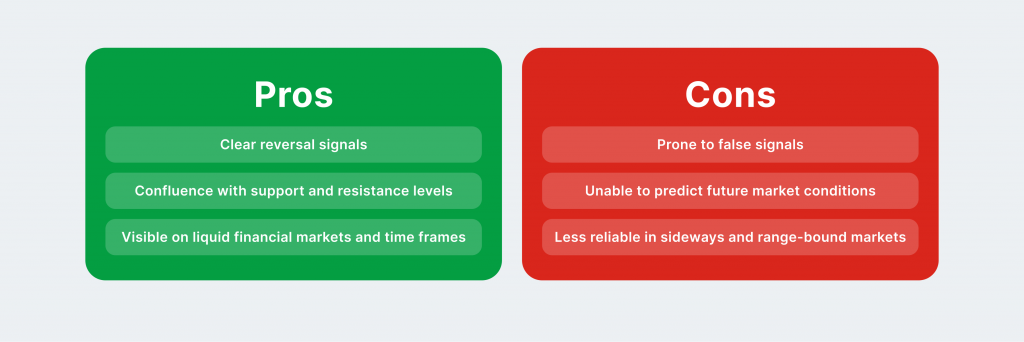
However, they are not foolproof and can produce false signals, especially in volatile or choppy market conditions.
Additionally, pin bars cannot predict future market conditions, as they supply info about conceivable reversals but do not offer certainty about the direction or strength of future trends.
Lastly, in sideways or range-bound markets, they may produce mixed or less reliable signals, making them less effective.
Closing Thoughts
Traders place high importance on pin bars as a trading strategy. They aid in forecasting shifts in pricing. However, these bars are commonly seen on charts, so traders must distinguish between false indications and wait for validation before making trades.
Employing a candlestick pin bar model in tandem with other signals and thorough examination can assist traders in making more sensible decisions and achieving improved outcomes in trending markets.


