
Exploring the Chance of a Double Bottom Recovery as Solana Holds at $24.5 Support
Amidst heightened concerns in the cryptocurrency market, Solana, the ninth-largest cryptocurrency, is stabilising around the $24.5 support level, demonstrating resilience as it has twice rebounded over the past three weeks.
This trend indicates active accumulation by participants while forming a bullish double-bottom pattern on the daily chart suggesting a potential reversal and portraying an optimistic outlook despite the prevailing market uncertainties.
Daily Chart: Solana Price Movement
The $24.5 support level retains its significance for traders, serving as a robust pillar of market stability. An optimistic prospect emerges with the potential for a bullish breakthrough beyond the $22.4 resistance, carrying the SOL price up by 12.4%, a substantial advancement that demands attention.
The trading volume over the past 24 hours for Solana coin totals $486.5 million, showcasing a commendable 10% increase. This heightened trading activity underscores the escalating interest and active engagement within the market.
In the daily time frame chart, the Solana price reveals the emergence of a double bottom pattern, recognised as a marker of potential market bottoming. This pattern inspires renewed buyer confidence, setting the stage for a sustained upward trajectory.
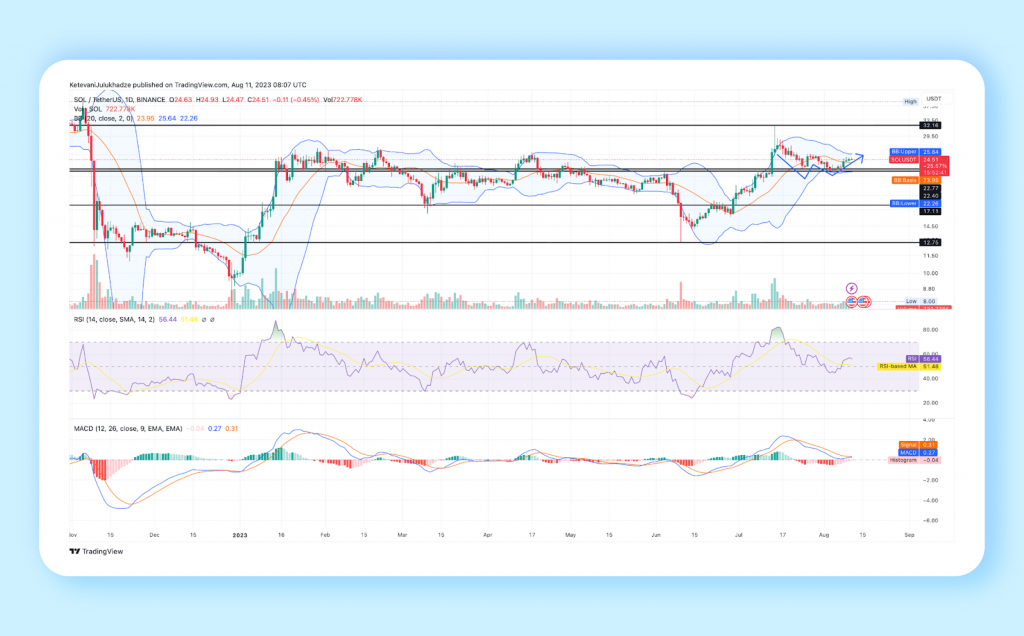
A pivotal time unfolded on August 7, with a noteworthy rebound from the $22.4 support level. This turnaround propelled the price by 8.8%, culminating in the current trading value of $24.5. Supported by this chart arrangement, the possibility of an additional 5.8% surge gains prominence, positioning the price for a test against the upper resistance at $25.7.
The prospect of a definitive bullish breakout beyond the previously mentioned resistance line augments buying pressure, potentially triggering a substantial price surge. In such a scenario, the SOL value could ascend from $29 to $30, unequivocally amplifying the coin’s momentum and bolstering bullish sentiment.
SOL Broke the Resistance Level Of $20 Is Heading To $26 By The End Of the Week
A lateral movement scenario and a narrow price range could ensue if the SOL price encounters robust selling pressure at the $24,5 threshold. While market buyers may attempt to rally, a sideways trajectory in the altcoin’s value could signal a weakening of bullish momentum. Should sellers capitalise on this air of uncertainty, a breach below $24.5 might herald a correction phase leading to $26.
Technical Indicators:
- Bollinger Bands: An upward movement within the lower band of the Bollinger Band indicator provides supplementary backing for market buyers.
Relative Strength Index (RSI): A potential ascent in the daily RSI slope beyond 60% could signify robust sentiment among traders.


