
Breaking Down the $SOL Price Surge: Exploring the Impact of $22.7 Support and Projecting a 25% Rally.
Solana’s price rally saw an impressive surge, peaking at the formidable $32.1 resistance level. However, this upward trajectory was met with a significant correction in the past two weeks, leading to a 29% decline in the coin’s market value. The downward trend found a crucial foothold at the $22.7 support level, which aligns with several other key technical supports. This convergence points towards a robust accumulation zone for potential buyers.
The question now arises whether this support can reignite the bullish momentum that seems to have faltered or if sellers will continue to exert pressure, prolonging the correction rally. The market’s response to this critical juncture will determine the course of Solana’s price movement in the near term.
Analysing Solana Daily Chart Of 31st Of July
- The daily chart for SOL displays a series of short-bodied candles, indicating uncertainty among traders.
- A key price level to watch is $25.7, as a bullish breakout at this point would signal the potential resumption of the recovery rally.
- Currently, the 24-hour trading volume for Solana stands at $251.5 Million, reflecting a 6.4% loss in the cryptocurrency’s value.
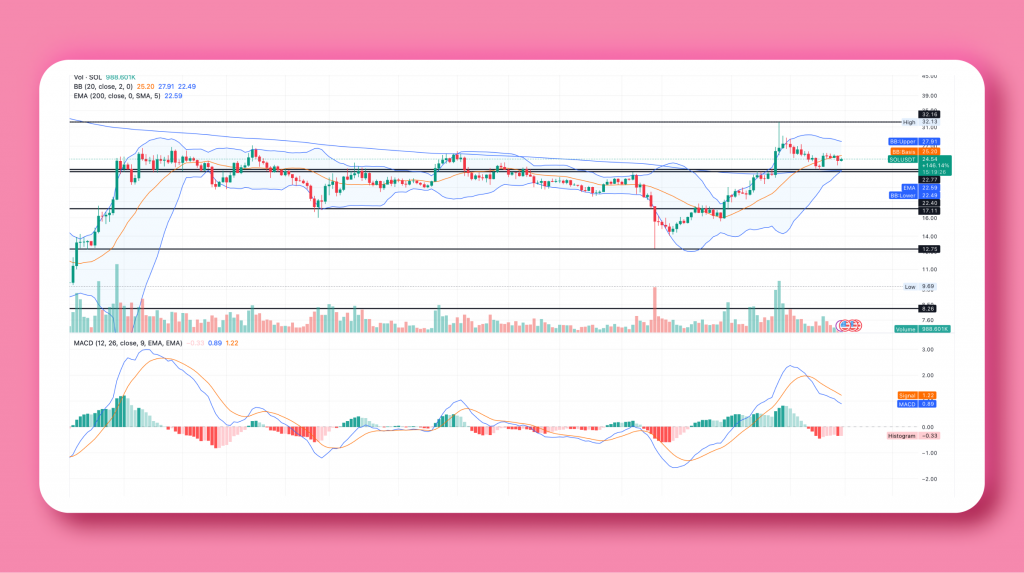
After witnessing a decline, Solana’s price managed to find strong support at the $22.5 level, coinciding with the 50% Fibonacci retracement level and the 200-day EMA. This alignment of key supports indicates a significant zone for potential market recovery.
A healthy pullback to the 50% level is considered beneficial as it allows the market to replenish buying pressure. Notably, on July 26th, Solana’s price experienced a rebound from the $22.7 support, forming a morning star candle pattern that served as an early signal for a potential uptrend continuation. This bullish reversal led to an 11.2% price surge, reaching a peak of $25.68.
However, the price trend turned sideways, lacking a suitable follow-up and weakening bullish momentum. Suppose the prevailing bearish market sentiment continues to pressure crypto buyers. In that case, the SOL price may likely remain above the $22.7 support for several more trading days, potentially necessitating the accumulation of enough bullish momentum to resume a stronger uptrend.
Will Solana Price Break the $32 Barrier?
Solana’s current price has surged above $24.5, and to solidify the bullish recovery, buyers seek further confirmation by observing a daily candle closing above the high of the previously identified morning star pattern at $25.68. Such a breakout would support the bulls significantly, potentially leading to a substantial 25.6% rally towards the $32.1 mark. Additionally, the ongoing recovery rally in SOL’s price appears to be influenced by the breakout of a symmetrical triangle pattern.
If this chart pattern holds, under strong bullish conditions, SOL price may climb to the range of $39.2-$40. This bullish scenario could potentially be in play as market participants closely monitor price action and trend developments in the coming days.
- The Moving Average Convergence Divergence (MACD) exhibits a bearish crossover as the blue slope dips below the orange signal line, signalling that the correction phase might not be fully invalidated yet.
- A noticeable downtick in the upper ceiling of the Bollinger Band indicator presents an added resistance barrier that could hinder the ascent of prices.
Traders and investors should closely monitor these technical indicators, as they provide valuable insights into Solana’s ongoing market trends and potential price movements.


